Private equity portfolios may be rising, but distributions tell a different story. The headline: Four years in, the liquidity drought is real.
Distributions
First, the good news. The net asset values in portfolios continue to increase.
NAV by Strategy
USD in Billions
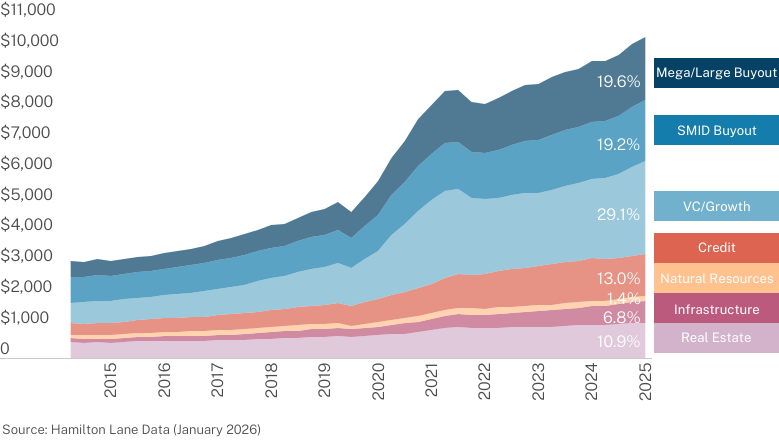
This is encouraging, a function of both new investment activity and rising portfolio valuations. In normal circumstances, we’d be quite happy with this chart. Now, the bad news.
Distributions
By Asset Class
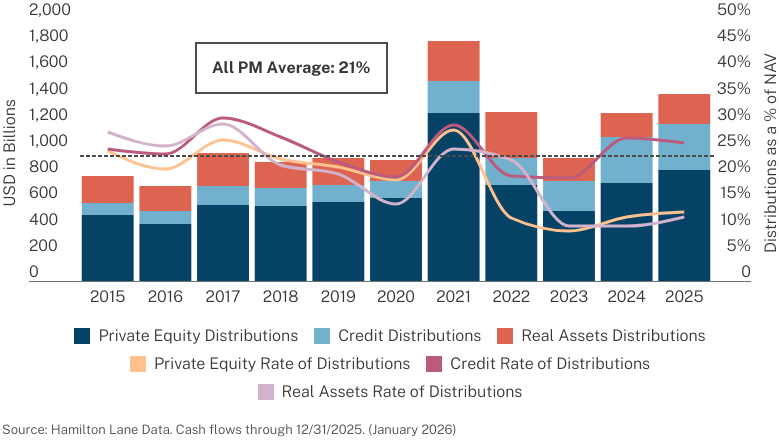

Distributions remain the top investor concern, with PE liquidity stuck below historical norms for a fourth year, leaving 2026 hopes possible but muted.
For many investors, Net Asset Value is synonymous with Never Attained Value. The reality is that, other than credit, the rates of money coming back for private equity and real assets have been dismal for four years.
Distributions at a Year 5 Correlated with Since-Inception IRR
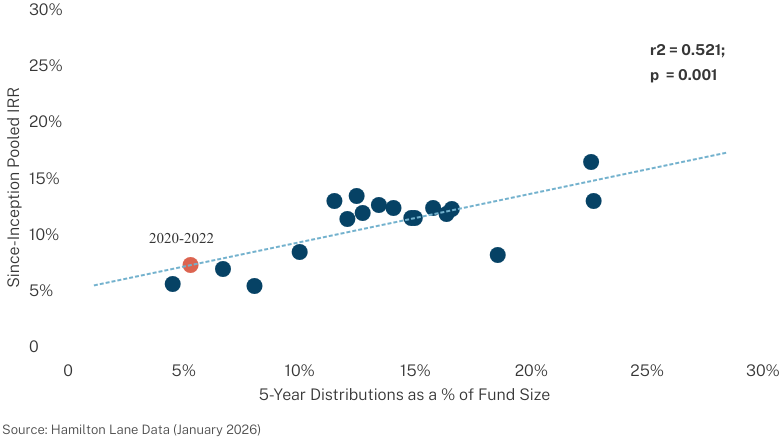
This may be the most important chart in the entire market overview. The amount a vintage has distributed by year five has a statistically significant correlation to ultimate IRRs. That is bad news for the ultimate performance of this fund cohort. Is it awful? Is it losing money? No and no, but it is not what you are looking to achieve in your private equity investments.
Median Exit Markups During the Year Prior to Exit
Global Buyout Deals Exited from Q1 2019 - Q3 2025
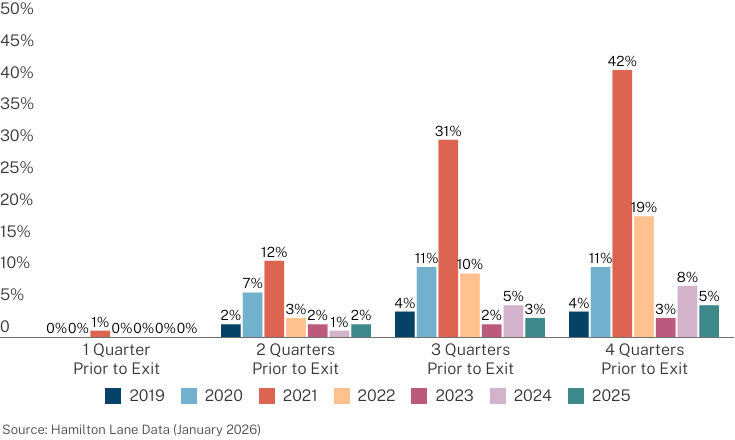
We have long pointed out that one of the components of private equity returns has been the markups that occur between the NAV one to four quarters prior to an exit and that exit value. No, this isn’t a function of fake valuations. It is often a function of factors such as not taking the control premium paid into a prior valuation number. However, as this chart shows, that exit markup is largely gone. Why? There may be some benign explanations, such as a greater percentage of exits are to continuation vehicles where there is no markup. (A topic for a future market overview.) Or, as skeptics would argue, it may be that valuations were inflated, so no markup was possible.
Only a small share of funds are generating meaningful exits, GPs expect limited near-term activity and weak markups plus longer holds are all factors keeping distribution pressure high.
Valuations
We embark on another discussion of valuations with some trepidation. We like to use data, but it seems that views on valuations are more like a discussion about religion or politics. It’s a belief, and facts are irrelevant.
Let’s try anyway:
Valuations are holding firm as buyers move up and multiples expand, signaling that pricing, not delusion, isn’t what’s blocking exits.
Investment Activity
We have used many words to describe places where private markets are performing below historical levels, distributions and performance being most prominent. Now, let’s revel in being average.
Investing is the one area holding steady, with 2025 activity near peak levels and AI reviving venture, while longer deployment times hint that buyout and credit may be entering a more attractive window.
Annual Private Markets Contributions
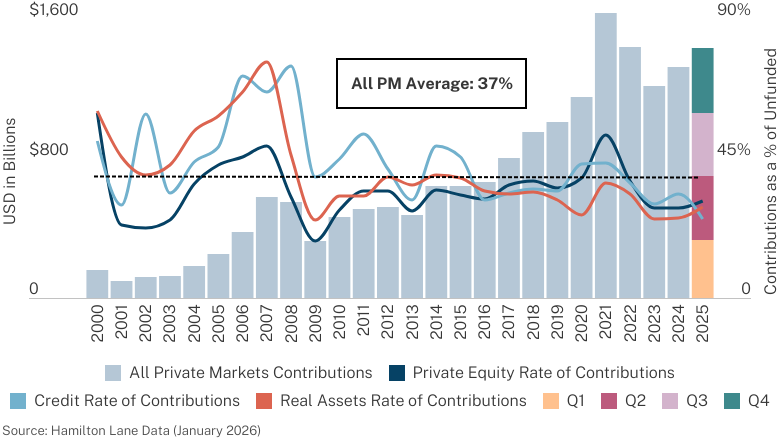
It might be surprising that the rate of investing is only slightly below historical averages. In absolute terms, 2025 is on par with 2022 and only a bit below the peak in 2021.
Time to Deploy Capital Overhang
Private Equity & Private Credit
Private Real Assets
This measures the time to deploy that capital overhang. A lot of it is noise, but there are interesting indicators when the time to deploy hits elevated levels. Right now, for example, buyout and credit are indicating that they could be entering more favorable periods. That seems counterintuitive and one indicator can’t be used alone, but this chart suggests now is a better time to invest in those areas than prior years.
Speaking of single indicators…
No surprise, we have a lot to say about purchase price multiples – and it’s not because we think they are going down.
Buyout Purchase Prices
Median EV/EBITD by Deal Year
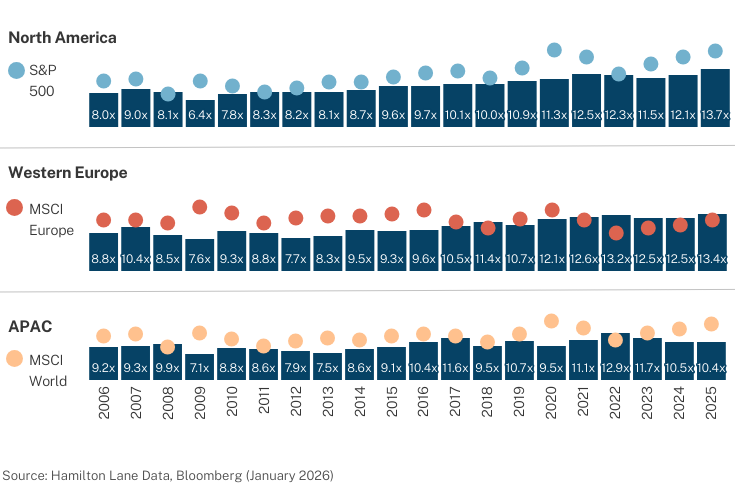
We’ve discussed on many occasions that, for many investors, this is the only indicator they use. Prices are up; returns must be coming down. The argument didn’t work for a decade but maybe it will now. From our perspective, buyout price multiples are quite high. They didn’t go down much after 2021 and, when they did, they rebounded quickly. That is true globally but — particularly in Western Europe — they are at record levels. We don’t think it means returns will be bad. It means a buyer’s margin for error is reduced.

2026 Market Overview Narrative
Our annual report offers a unique perspective on the private markets, leveraging our firm’s industry expertise, research capabilities and expansive database to help investors navigate the evolving investment landscape.
Dive deeper into the data with our full narrative, a comprehensive exploration of what’s driving markets now.