In this market, the supply of opportunities far outstrips the capital chasing them, creating a buyer’s market filled with high-quality deals, disciplined pricing and strong outcomes across both LP-led and GP-led transactions.
There’s a lot of concern that the secondary market is now nothing but a GP-led continuation vehicle market. It is said with the subtext that GP-leds are inherently bad, and we’ll deal with that misconception in a few moments. But the underlying premise is not true.
Total Secondary Market Volume
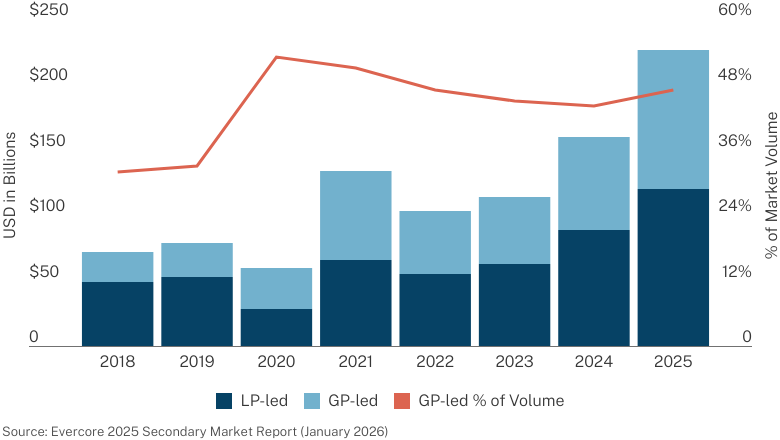
The entire secondary market has grown, and, in fact, GP-led deals are holding steady as a percentage of deals at around 50%. That has been true for years now. LP-led deals remain a growing and healthy part of the secondary market.
LP Portfolio Pricing
% of RD NAV
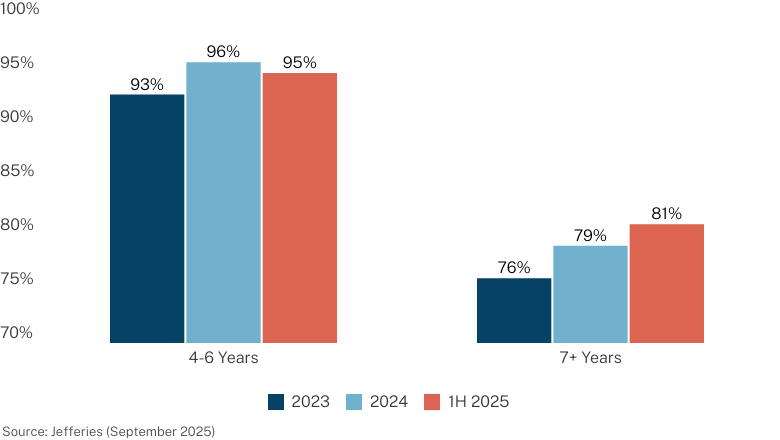
We broke down discount levels by age of portfolio. This relates back to our prior discussion about evergreens and secondary pricing. For mature portfolios – 4-6 years – pricing has remained steady for the last three years. The market doesn’t seem too bullish or bearish. For tail-end funds – those that are over seven years old – pricing has risen more, largely driven by evergreen vehicles. Why? The discount is larger. You may be, in many cases, trading a larger discount today, for less asset appreciation tomorrow. That’s a tricky balance and we do worry that some evergreen vehicles are not keeping that balance in play. They are willing to take that larger discount today and worry about tomorrow if and when the time may come. Unfortunately for investors, and for all of us in these markets, that time will certainly come.
We have dealt with LP-led pricing, so let’s turn to the horrors of GP-led transactions.
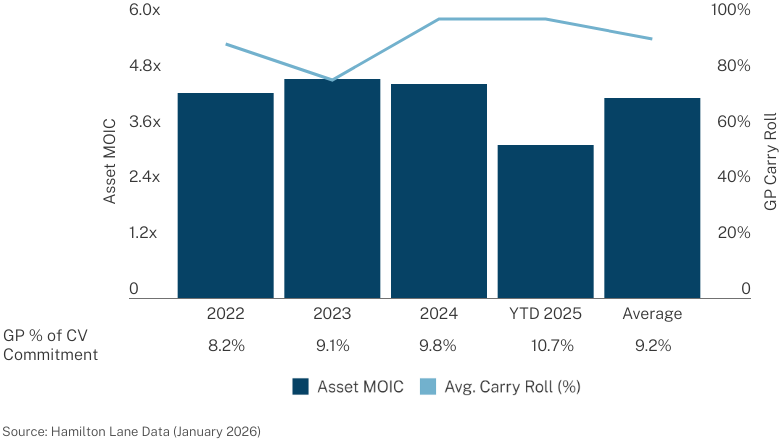
Average Asset MOIC Prior to CV & GP Alignment
There’s a view that GP-led deals are for inherently bad companies filled with insoluble conflicts that shows how bad a state private equity is in.
Let’s see, three assertions: Wrong. Wrong. Wrong.
The average gain on GP-led deal companies is over four times multiple of capital. These are companies that have done very well for the general partner. These aren’t zombie or orphaned assets. General partners are, on average, rolling almost all of their carry into the deal. Yes, we understand that, from some perspective, that is rolling someone else’s money, but we don’t think any general partners have that view. It is their money because, if they wanted, they could sell the company, even if for marginally less, and pocket that carry. They believe in the deal enough to re-invest. Finally, if you look at the average general partner commitment as a percentage of the transaction, it is well above almost any general partner commitment to a fund.
One last point. The state of the secondary market today is such that there are many more deals that want to be done than capital available. That makes for a very selective set of deals that can clear the market. Yes, the best of them. Are there bad deals proposed? Yes. Are there deals proposed that have conflicts too severe to be comfortable to investors? Yes. The answer? They don’t get done. Secondary buyers move to the next deal. There are plenty more available.

You’ve seen the secondary market’s staggering growth. Did you also notice how balanced the market has been between LP and GP-led secondaries? This raises some questions...
Let’s look at return profiles of GP-led deals.
TVPI
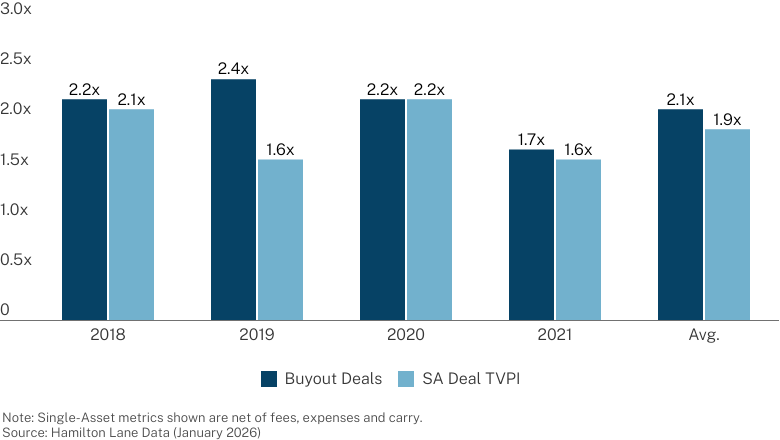
We are comparing single-asset secondaries to buyout deals from the same vintage year. Buyout deals have performed slightly better, but do you really look at that chart and say, “Well that proves single-asset deals are lousy companies and inherently conflicted!” Let’s compare the single-asset deals to co-invests, something to which they are often compared.
Distribution by MOIC
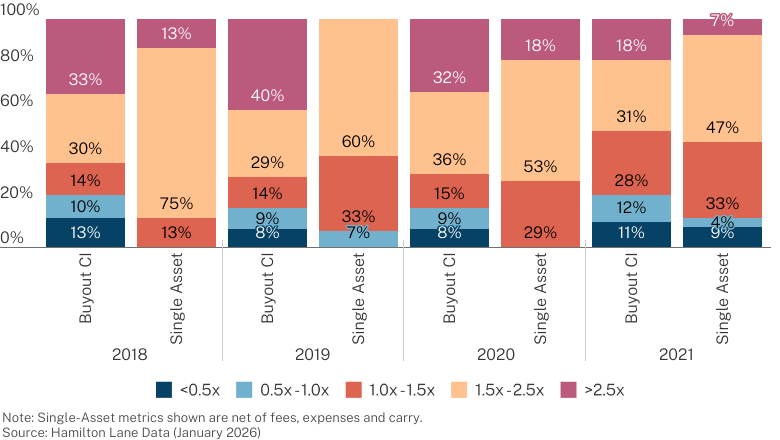
Interesting. While all you read in the media is about single-asset deals that didn’t work, the reality is that their loss ratios are lower than co-investment deals. They’re lower than the numbers we showed earlier for the buyout universe. Yes, the upside capture is lower for the single-asset deals and your range of return is narrower.
This return distribution is sensible. CVs should have less downside: The underlying assets are well known to the GP, and the GP is unlikely to bet all their accrued carry on a risky business. That means the upside should also be lower since quality assets will command a higher valuation. You might say the risk-adjusted returns for CVs are similar to the risk-adjusted returns for CI deals.
You need secondaries in your private markets portfolio. Not just for J-curve mitigation. You need it for return, first and foremost. Too many investors are under allocated to secondaries. Buy more. Buy more now.

2026 Market Overview Narrative
Our annual report offers a unique perspective on the private markets, leveraging our firm’s industry expertise, research capabilities and expansive database to help investors navigate the evolving investment landscape.
Dive deeper into the data with our full narrative, a comprehensive exploration of what’s driving markets now.