Despite the noise, private credit fundamentals are solid.
It is difficult for anyone who has been in this asset class for less than 10 or 15 years to imagine what private credit was like before that. It was a cottage industry with primarily mezzanine and distressed managers. Only 466 funds as recently as 20 years ago. Now, 10 times that number and about 24 times the market size. This is just the closed-end world and, in our view, doesn’t capture what’s really going on here.

In a year where the cockroach became synonymous with private credit and the threat of a credit bubble became the prevalent force, we say think again.
We discussed closed-end funds as the general partners’ lifeblood. It is for equity strategies. Is it for credit?
Total Exposure of Closed-End Private Credit
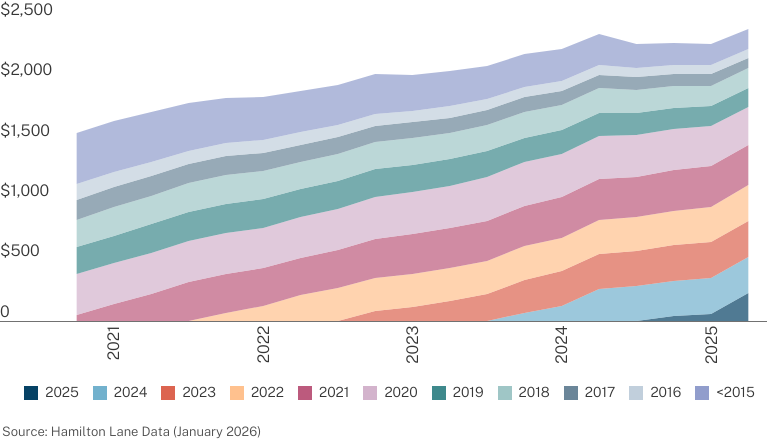
$2.4 trillion is a pretty good size. You then add all the capital from captive or affiliated insurance companies, and you have a really good size. But there’s a whale entering these waters and it’s big.
Private Credit Evergreen AUM
USD in Billions
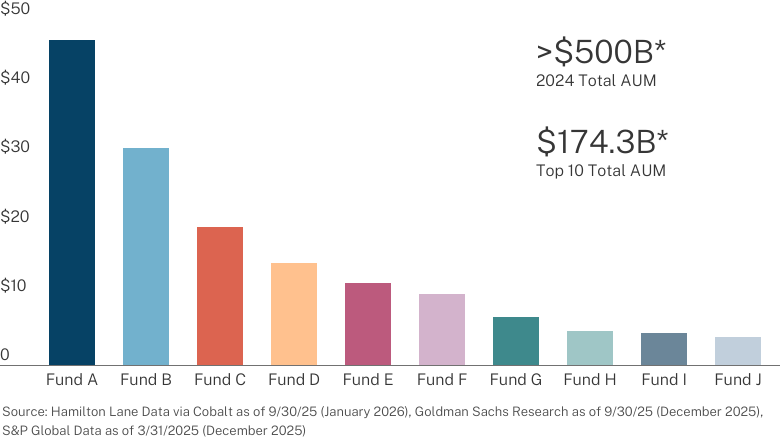
The evergreen world has gone from, effectively, $0 to $500 billion in that last decade. And the top managers are vacuuming up impressive sums: The largest evergreen fund’s NAV exceeds the combined NAV of the five largest closed-end funds raised in 2024.
We think the share of private credit dollars allocated to evergreen funds will only increase. We heard a top executive at one of the large U.S. investment banks say that their internal view is that closed-end funds in the credit space will largely disappear in a few years. Hyperbole, but we agree it is directionally accurate.
It is no surprise that the growth in private credit has impacted market share.
Share of Global Buyouts Over $1B
By Financing Type
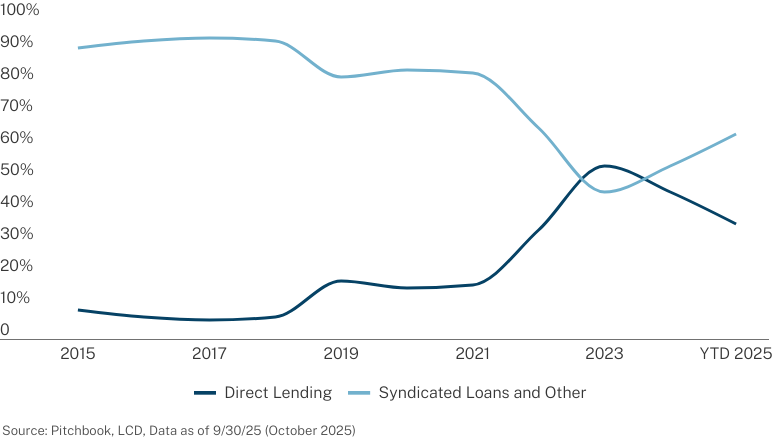
From being a relatively minor player up to 2018, private credit took almost 50% of the LBO financing market from public and syndicated bank lending markets. The last couple of years have seen the broadly syndicated market take back share. Let’s ask a question about that: At what cost? Do we think the recent spate of defaults and frauds that have made headlines are a function of private credit actions or syndicated loan actions? More on that later.
With the increased capital available, with the increase in market share, with the ongoing press about the pressures on private credit, the casual observer would think that yields and spreads of private credit over broadly syndicated loans were collapsing.
Spread of LBOs Financed in Private Credit vs BSLs

That would be a completely incorrect assumption. Sponsors want private credit and seem willing to pay for what it has to offer. There is no sign of stress with these spreads or returns, relative to BSLs. None. But let’s keep looking because we are incessantly told private credit is in a bubble.
Median Purchase Price and Leverage Multiples
By Deal Vintage
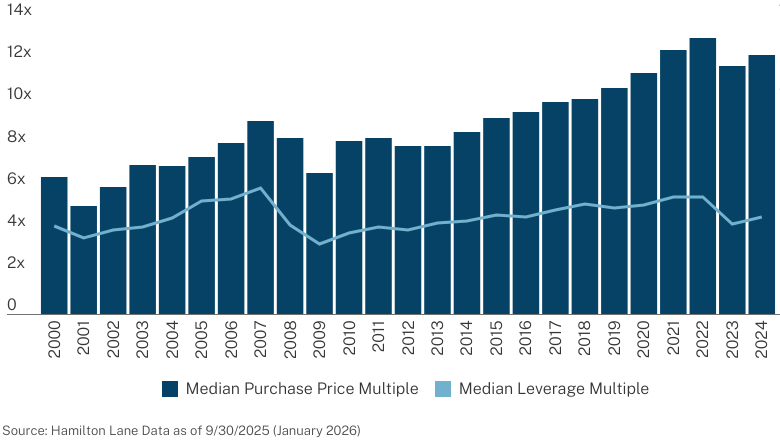
Here is one of the features of this current cycle that is different from prior cycles: As prices went up for acquisitions, leverage levels didn’t follow them up. For all the talk of the desperate private capital providers throwing money at deals, well, they didn’t. The equity cushion, that layer below the credit providers, is large. Very large. The credit is safer than it has been in prior cycles. Let’s look further and borrow a chart we generally use at the end of our overviews.
Credit Sentiment
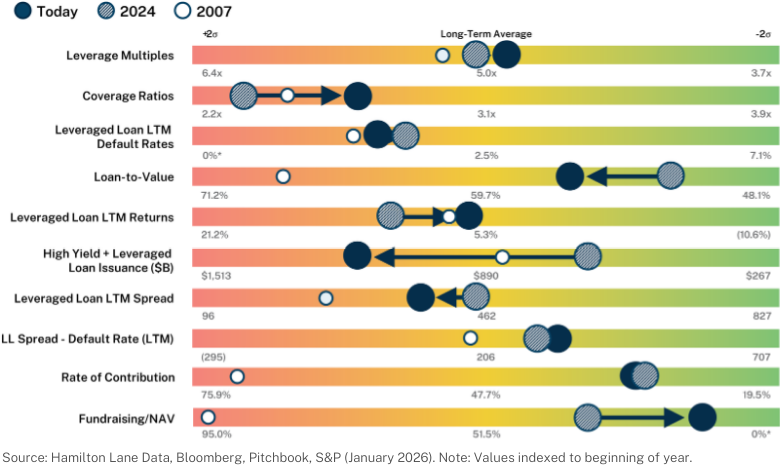
Tell us, where are the signs of stress? Where are the signs of a bubble? Sure, they may be metaphysical, beyond the comprehension of numbers. Even there, we’re not seeing it. Everything looks average. Even coverage ratios are getting better. Is it super bullish? No. Is it super bearish with any indication of imminent danger or collapse? No.

2026 Market Overview Narrative
Our annual report offers a unique perspective on the private markets, leveraging our firm’s industry expertise, research capabilities and expansive database to help investors navigate the evolving investment landscape.
Dive deeper into the data with our full narrative, a comprehensive exploration of what’s driving markets now.