July 30, 2026
Stock-Bond Correlations Remain Unpredictable
Rolling 1Y Correlation of Public Equity and Bond Returns, USD
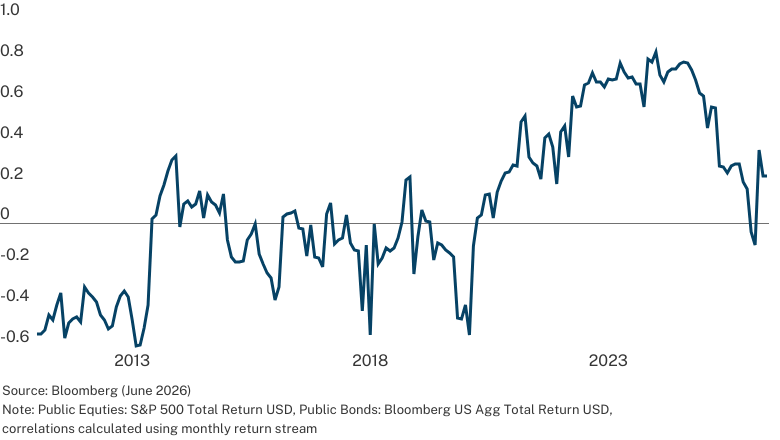
The Search for Diversification
For years, many portfolios relied on stocks and bonds to play complementary roles. But in recent years, that relationship has become far less dependable. As inflation, fiscal pressures, geopolitics and interest rate regimes have reshaped markets, stocks and bonds have more often moved in tandem, reducing the diversification benefit investors once expected from a traditional 60/40 mix.
At the same time, public equity returns have become increasingly concentrated in a narrower group of companies, sectors and risk factors. While this chart uses U.S. public equities and bonds, the implication is broader: many global portfolios still lean heavily on the same public-market drivers. When stock-bond relationships shift and equity leadership narrows, diversification can prove thinner than it appears.
For investors seeking assets that behave differently from one another, this chart is a useful reminder that diversification is becoming harder to find in public markets alone.
See how this impacts portfolios for European investors.
July 23, 2026
S&P 500 Software and Services Sector Relative to the S&P 500
% Premium (Forward Price to Earnings Ratio)
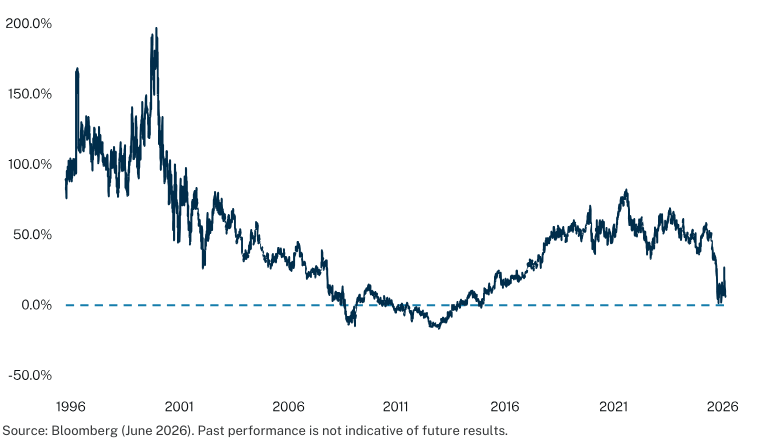
SaaS is Not Dead
The rise of AI has sparked existential questions about the future of traditional software as a service (SaaS). The chart shows software stocks trading at one of their lowest valuation premiums to the broader market in years, reflecting investor uncertainty around how AI will reshape the sector. However, a more nuanced story lies beneath the surface.
AI is not eliminating software. Instead, it is accelerating a separation between winners and losers. Software with deep workflow integration, proprietary data and strong customer trust is well positioned to embed AI, expand functionality and improve margins. At the same time, SaaS companies with less differentiation and a weaker competitive moat face real obsolescence risk.
This dynamic is not unique to AI. Previous technology shifts, including the transition from on-premise software to cloud computing and later to mobile, reshaped competitive landscapes without eliminating incumbents altogether.
Learn more about Hamilton Lane’s approach to navigating the current venture landscape.
Venture Capital: Venture Capital includes any PM fund focused on financing startups, early-stage, late stage, and emerging
July 16, 2026
Millennials Show the Biggest Rise in Private Markets Interest
Which generation has shown the greatest increase in interest in private markets?
.png?language=en-US)
The Great Wealth Transfer's Private-Markets Moment
More than $124 trillion in U.S. household wealth is expected to transfer across generations through 20481. The U.S. accounts for roughly one-third of global household wealth, making it the single largest contributor to the worldwide wealth transfer underway.
This Great Wealth Transfer is more than a demographic shift — it may also reshape who drives demand for private markets. In Hamilton Lane’s 2026 Global Private Wealth Survey, 55% of respondents said millennials, ages 30-45, have shown the greatest increase in interest in private markets.
As wealth changes hands, a new generation of investors is likely to play an increasingly important role in shaping demand for private markets. While we don’t know how those new investors will view private markets, our survey points to a greater interest in private markets. For advisors and asset managers, that means private market education access, and portfolio conversations may become more important than ever.
1Cerulli Associates (June, 2025)
July 9, 2026
A growing proportion of VC deals Globally and in the US are Mega Deals
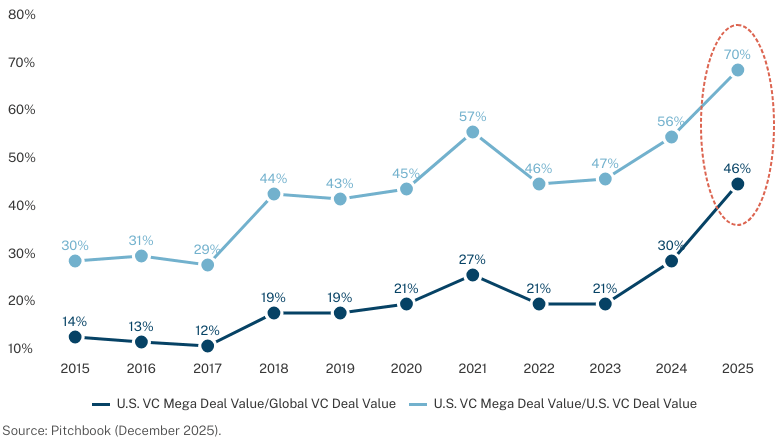
Capital is concentrating in the venture market
In today’s venture market, capital is increasingly concentrated in fewer, larger deals. In the U.S., mega-deals ($100M+) now account for a growing majority of total capital deployed, highlighting a meaningful shift in how venture funding is distributed.
This dynamic reflects the rise of companies scaling rapidly at unprecedented levels, particularly in AI. Capital is flowing disproportionately to companies demonstrating early, decisive revenue traction, often at a scale and speed previously unseen in venture.
For investors, this does not reduce opportunity. In fact, it raises the bar. Access, manager selection and sourcing advantage are becoming increasingly important in a market where fewer companies are capturing a greater share of capital.
Learn more about Hamilton Lane’s approach to venture capital.
Venture Capital: Venture Capital includes any PM fund focused on financing startups, early-stage, late stage, and emerging
July 2, 2026
Private Credit IRR vs. PME
By Vintage Year
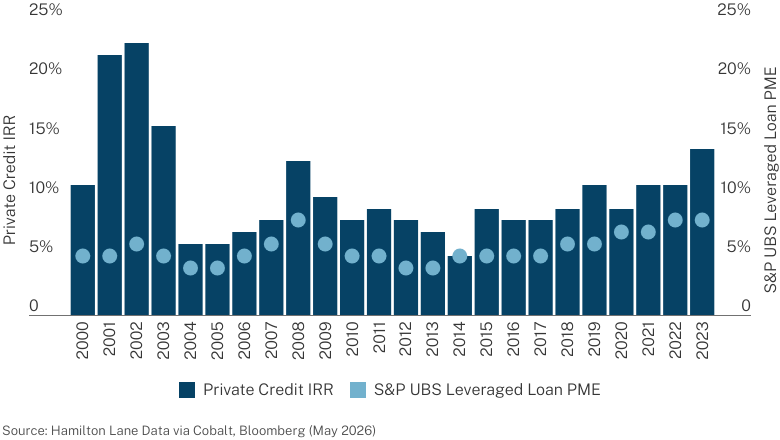
Private Credit: Consistency of Performance
The data is clear: private credit has consistently delivered strong returns and outperformed public credit benchmarks.
The chart compares private credit IRRs to the S&P UBS Leveraged Loan PME by vintage year from 2000 to 2023 and the result is striking: private credit has outperformed the public leveraged loan markets in all 24 vintages shown. More recent vintages show a steady pattern of mid-to-high single-digit to low double-digit returns.
This outperformance spans a wide range of market environments, including the early 2000s downturn, the Global Financial Crisis (GFC) and more recent periods of volatility. Even during challenging periods, private credit has maintained a consistent edge over public markets.
These results reflect more broadly on the structural advantages of private credit. Learn more about the fundamentals of this asset class.
For illustrative purposes only. Past performance is not indicative of future results
Credit: This strategy focuses on providing debt capital.
June 25, 2026
Education sparks client interest
How has providing education on private markets impacted your clients' interest?
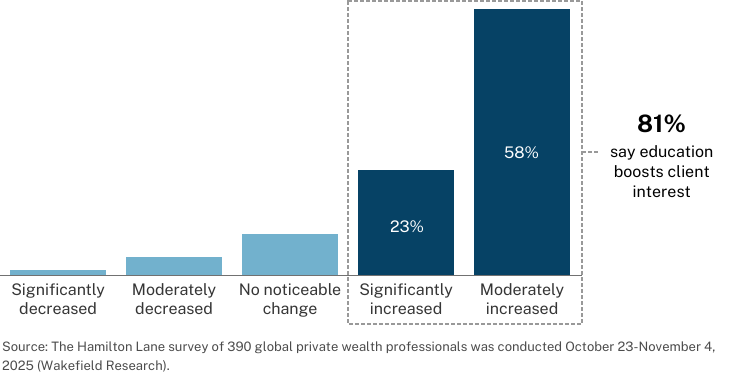
Private Markets Education Sparks Client Interest
Education is helping turn curiosity into engagement. Wealth professionals in our 2026 Global Private Wealth Survey, report higher client interest when education is provided, reinforcing the value of clear, accessible investor education.
That matters because clients still have important knowledge gaps — especially around current products available, liquidity constraints, sector trends and underlying deals. By addressing those gaps through a mix of one-on-one sessions, digital resources, webinars, in-person events and third-party materials, advisers can create more meaningful client conversations and help investors better understand the role private markets can play in portfolios.
June 18, 2026
Count of LBOs Financed in BSL vs. Private Credit Markets
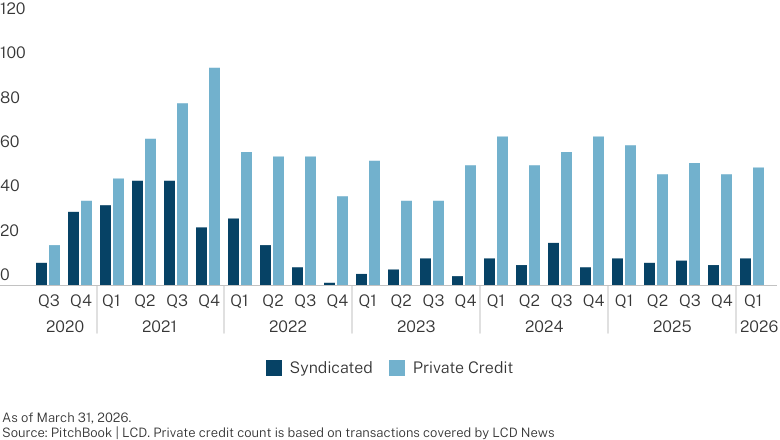
Private Credit: Leveraged Buyout’s Go-To Lender
While deal count used to be more evenly spread across private credit and bank syndicated loans, this pattern has shifted. Direct lending now finances a clear majority of leveraged buyouts (LBOs) by number of transactions, while broadly syndicated loan (BSL) activity has declined to a smaller share of overall deal count.
The BSL market continues to fund many of the largest private equity transactions, meaning its share of total capital deployed is still significant. By contrast, private credit is more heavily focused on lending to companies in the mid-market, where the number of borrowers and therefore transaction count is greatest.
Mid-market private equity borrowers place a premium on speed, flexible terms and the ability to negotiate directly with a small lender group rather than run a public syndication process. Private credit can often provide this certainty and tailor structures to borrower needs.
Investors seeking credit exposure to high quality, growing mid-market businesses should look to private credit to complement traditional public credit or syndicated credit exposure.
Learn more about the opportunity in private credit today.
Credit: This strategy focuses on providing debt capital.
June 11, 2026
Survey: Access Is a Key Reason Clients Turn to Private Markets
Rank the top 4 motivations for your clients’ private market investments.
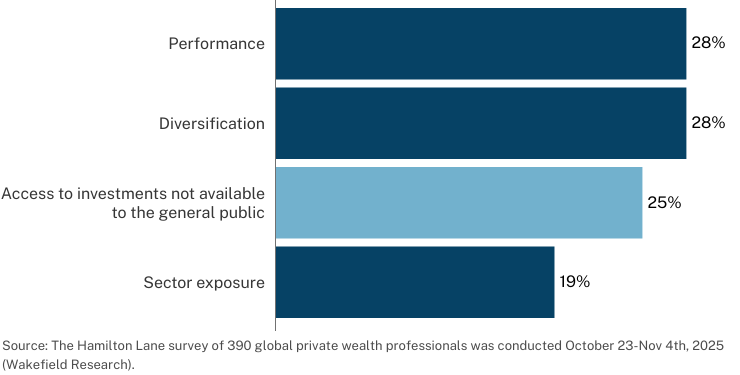
Top Motivations Behind Private Market Investing
Performance and diversification remain the most frequently top-ranked motivations for private market investing, each cited by 28% of respondents. But access is close behind at 25% — well ahead of sector exposure at 19%.
The takeaway: Clients are seeking exposure to attractive investments that are less accessible through traditional public market channels.
For some portfolios, venture and growth strategies can offer access to companies earlier in their value-creation journey, before they reach the public markets.
Hear our experts discuss venture and innovation in today’s market.
June 4, 2026
Evergreen Funds Have Shown a Narrower Dispersion of Returns
Trailing 3-Year Dispersion of Returns As of 9/30/2025
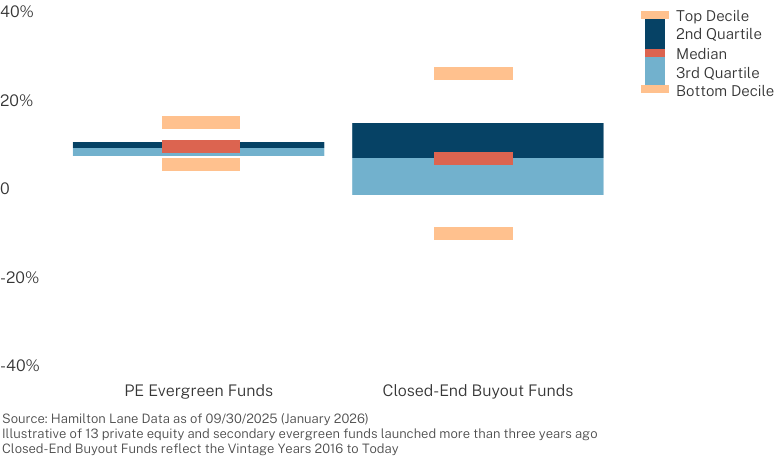
Evergreen Funds: Tighter Dispersion, Real Differences
This chart compares the dispersion of returns for evergreen private equity funds and traditional closed-end funds over trailing three-year periods. The key takeaway: Evergreen funds have exhibited a narrower range of outcomes than closed-end funds over a short time horizon.
Even within that tight band, manager selection remains critical. The difference between a top-quartile and bottom-quartile evergreen fund in this sample is still more than roughly 300 bps on a 3-year timeframe, underscoring the importance of due diligence and manager quality.
For investors, the pattern raises an important consideration: Evergreen structures may offer a way to seek private equity exposure with relatively less performance dispersion, while still requiring thoughtful manager selection to capture the upper end of the range.
May 28, 2026
Private Markets Opportunities by Strategy
Opportunities Received by Hamilton Lane
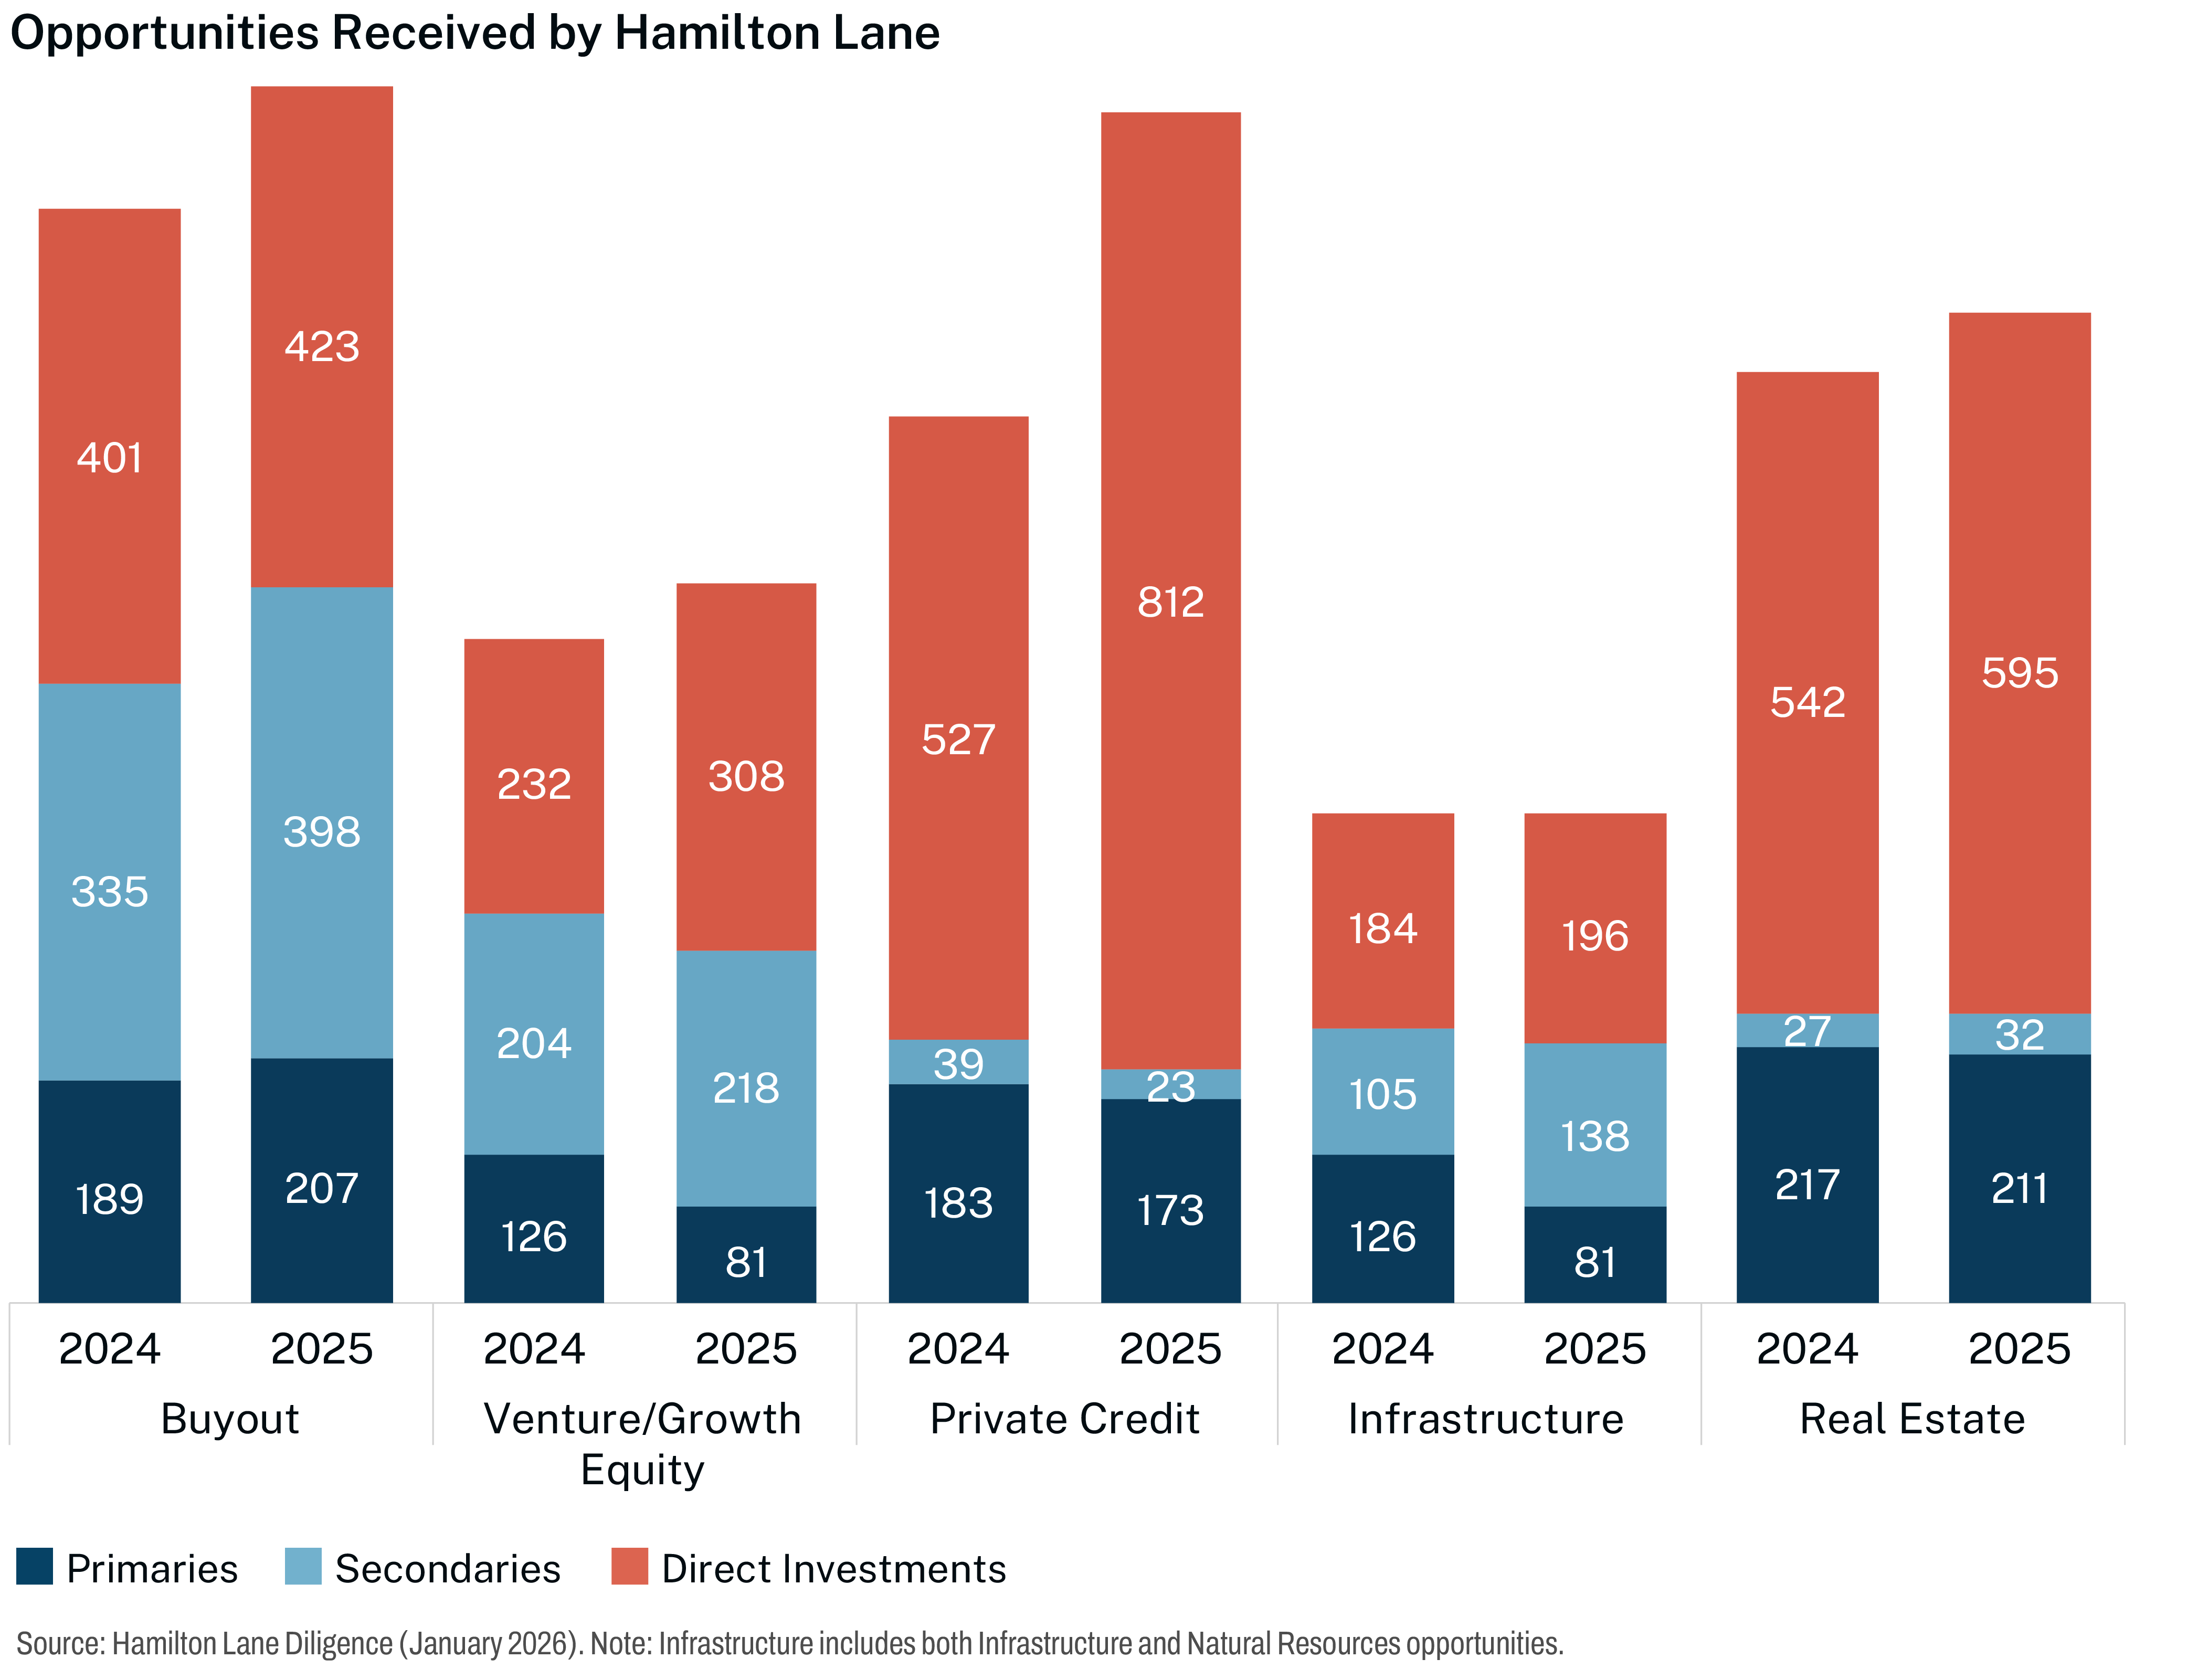
Zeroing In On Attractive Deals
Relative to other strategies, we see co-investment opportunities (direct investments) continuing to climb, even as primary fund opportunities remain flat or decline. Why?
When the fundraising prospect for a fresh fund appears less certain, general partners may elect to conserve fund capital and more frequently partner with co-investors.
This tells us that declining fundraising numbers are due, to some extent, to less capital available but, to a greater extent, fewer opportunities are available, at compelling prices. Partnering with managers with the relationships, capital, and data-driven analytics to access these opportunities can help investors meet their portfolio objectives. Read more in our 2026 Market Overview.
Closed-End Primary Fund: A private markets fund with a fixed term, typically raised in one or more closings during a fundraising period, where investors commit capital that is drawn over time and returned over the life of the fund.
Secondary Transaction: Purchase of a limited partner interest in an existing private markets fund or an investment into asset(s) / fund(s) alongside a general partner.
Direct Transaction: An investment directly in the equity or debt of a single company or asset, alongside a general partner.
May 21, 2026
Buyout Purchase Price Multiples
By Sector, 2018 - 2024
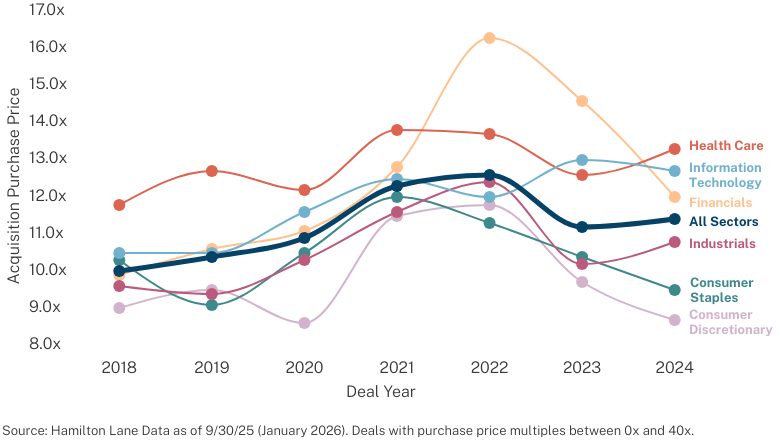
What Have GPs Been Paying for Assets?
It is well understood that during the 2021–2022 market peak, capital was abundant, sentiment was strong and GPs were willing to “pay up” for assets. This chart quantifies that dynamic at the sector level. Across the buyout universe, entry purchase price multiples stepped up meaningfully versus 2018–2019, with the sharpest move in information technology, where 2021 deal multiples ran more than two turns higher than pre‑COVID levels.
By 2024, the mix of deals had shifted: technology represented a larger share of overall buyout activity — but the story isn’t just about tech mix. Even after adjusting for that tilt, there is still clear evidence that prices increased across most sectors relative to earlier years, suggesting a broader reset in the clearing price for quality assets.
For investors, that raises the bar for value creation. When entry prices are high, a greater emphasis is placed on earnings growth, operational improvements and disciplined use of leverage rather than from further multiple expansion from a hotter market. Sector and vintage selection matter: understanding where and when GPs paid the highest prices can help frame expectations for dispersion in outcomes — and highlight why disciplined underwriting and portfolio construction are so important in a higher‑entry‑multiple world.
Learn about Hamilton Lane’s approach to evergreen funds.
May 14, 2026
3-Year Cumulative Infrastructure and Private Credit Returns
Cumulative Time-Weighted Returns, Q3 2022 – Q3 2025

Three-Year Standouts: Infrastructure and Private Credit
Over the last three years, cumulative returns in infrastructure and private credit have beaten buyout, growth equity and venture capital, highlighting how income-oriented, less market-sensitive strategies have led the way during a period of heightened uncertainty.
This data suggests allocations to credit and infrastructure may help investors diversify portfolios, providing a boost during periods of pronounced equity volatility.
Over time, equity strategies are likely to outperform, albeit with higher risk levels. Partnering with the right private markets platform can help align portfolio strategy allocations with long-term goals. Read more in our 2026 Market Overview.
Corporate Finance/Buyout: Any PM fund that generally takes control position by buying a company.
Private Credit: This strategy focuses on providing debt capital.
Growth Equity: Any PM fund that focuses on providing growth capital through an equity investment.
Infrastructure: An investment strategy that invests in physical systems involved in the distribution of people, goods, and resources.
Venture Capital: Any PM fund focused on financing startups, early-stage, late stage, and emerging companies or a combination of multiple investment stages of startups.
Time-weighted Return: Time-weighted return is a measure of compound rate of growth in a portfolio.
May 7, 2026
What percentage of your portfolio companies (by count) are actively using AI today?
AI Adoption Jumps Across GP Portfolios
AI implementation is clearly a growing priority across GP portfolios — and the shift over the past year is striking. In 2024, 44% of respondents reported that 80–100% of their portfolio companies were actively using AI. In 2025, that share jumps to 61%, meaning nearly two-thirds of surveyed GPs now see AI in use across the vast majority of their holdings.
At the same time, lower-adoption buckets are shrinking. That suggests AI is moving from isolated experiments to a core part of operating playbooks, with very few GPs now overseeing portfolios where AI isn’t present at all.
The middle of the distribution is compressing as well. Responses in the 20–60% range edge lower year over year, indicating that many managers who were in “early rollout” mode are now pushing AI across the rest of their portfolios.
For investors, this reinforces a key takeaway: AI is rapidly becoming table stakes for portfolio companies looking to drive efficiency, enhance decision-making and stay competitive — and the differentiator may increasingly be how well, not whether, companies put these tools to work.
Learn more about exposure to AI in private markets.
April 30, 2026
Private Credit Still Provides Excess Yield vs BSLs
Spread of LBOs Financed in Private Credit vs BSLs (bps)
Private Credit: 147 bps of Historical Outperformance
From a niche player, private credit has grown to finance nearly half of LBOs, even as syndicated loans have recently clawed back share. The speed of capital flowing into private credit has led to questions of whether private credit can sustain its healthy return premium over broadly syndicated loans (BSLs).
If private credit were becoming meaningfully overcrowded, we would expect spreads over BSLs to compress materially as new entrants compete away on price.
Instead, 2025 YTD spreads still show a meaningful premium, as sponsors continue to pay up for flexibility, speed, and relationship-driven execution.
Read more in our 2026 Market Overview.
Chart referenced is from the Hamilton Lane 2026 Market Overview. Note: 50% represents the peak back in 2023; most recent figure as of Q3'2025 is closer to 40%. Past performance is not an indicator of future results.
Credit: This strategy focuses on providing debt capital.
April 23, 2026
Hyper Concentration of Public Equity Indices
The 10 largest U.S. stocks account for >20% of global index value
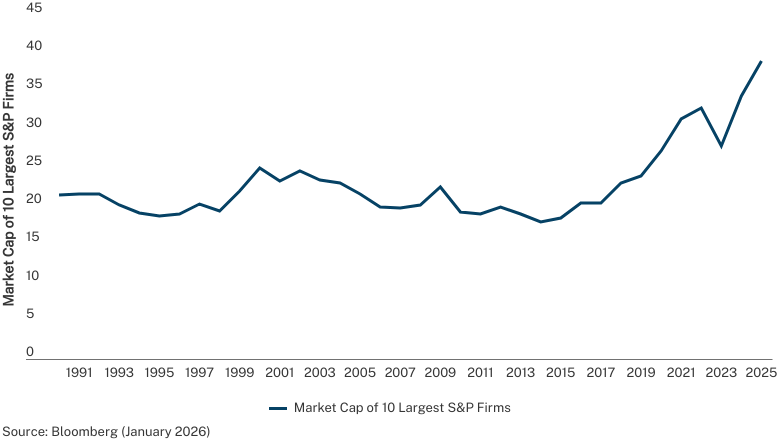
The Case for Looking Beyond Public Markets
The share of global equity market value captured by a handful of U.S. mega‑caps has risen meaningfully, with today’s concentration levels sitting close to historic peaks. This chart tracks the weight of the top 10 companies within the S&P, illustrating three important dynamics:
Concentration is cyclical – but today is extreme. Periods like the dot‑com era, and today’s AI‑driven market all show spikes in the dominance of a small number of U.S. stocks. In the S&P 500 specifically, the top 10 companies now account for over 40% of the index’s total market capitalization, one of the highest readings in our data series.
Recent leadership is narrowly defined. Today’s top companies are heavily tilted toward U.S. technology and AI‑related businesses, meaning investors tracking broad public indices are implicitly making a large thematic bet on a single cluster of business models, geographies and risk factors.
Index investors own more of the same risk than they may realize. For many private wealth portfolios that are already public‑heavy, this chart underscores that “diversification” across multiple index funds can still translate into concentrated exposure to the same small group of names.
Against that backdrop, private markets can play a central role in rebalancing portfolio risk.
Learn more about the role of diversified evergreen funds in today’s market environment.
April 16, 2026
Periodic Table of Returns
Pooled IRR by Vintage Year
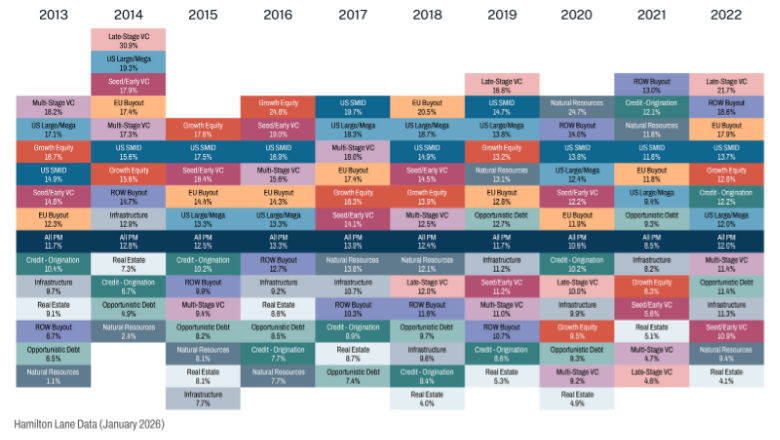
Private Markets’ Persistent Double-Digit Returns
This “periodic table” of pooled IRRs by vintage year shows a few important truths. First, there is a wide spread in performance by strategy (and risk). Second, some strategies show more cyclicality than others, appearing at the top in some years and towards the bottom in other years (late-stage venture and ROW buyout are good examples). Finally, there are very few instances of loss at the strategy level.
Despite the noise about fading returns, almost every private markets vintage over the last decade has delivered double‑digit performance. Read more in our 2026 Market Overview.
All Private Markets: Hamilton Lane’s definition of “All Private Markets” includes all private commingled funds excluding fund-of-funds, and secondary fund-of-funds.
EU Buyout: Any buyout fund primarily investing in the European Union.
Growth Equity: Any PM fund that focuses on providing growth capital through an equity investment.
SMID Buyout: Any buyout fund smaller than a certain fund size, dependent on vintage year.
U.S. Mega/Large: Any buyout fund larger than a certain fun
U.S. SMID: Any buyout fund smaller than a certain fund size that depends on the vintage year and is primarily investing in the United States.
Seed/Early VC: A venture capital strategy that provides funding to early-stage startups.
Origination: Includes any PM fund that focuses primarily on providing debt capital directly to private companies, often using the company’s assets as collateral.
Multi-Stage VC: A venture capital strategy that provides funding to startups across many investment stages.
Infrastructure: An investment strategy that invests in physical systems involved in the distribution of people, goods, and resources.
Real Estate: Any closed-end fund that primarily invests in non-core real estate, excluding separate accounts and joint ventures.
ROW: Any fund with a geographic focus outside of North America and Western Europe.
ROW Equity: Includes all buyout, growth, and venture capital-focused funds, with a geographic focus outside of North America and Western Europe.
Natural Resources: An investment strategy that invests in companies involved in the extraction, refinement, or distribution of natural resources.
Distressed Debt: Includes any PM fund that primarily invests in the debt of distressed companies.
Credit: This strategy focuses on providing debt capital.
April 9, 2026
Evergreen Funds Have Outperformed Closed-End Funds
Annualized Return by Fund Structure
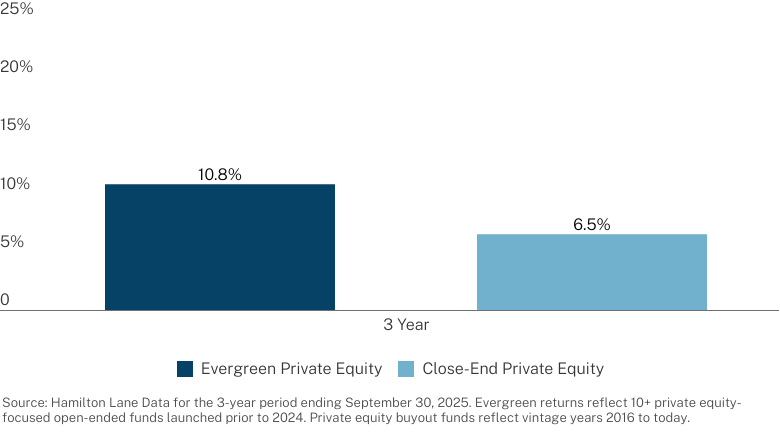
Evergreen Funds: Rethinking the Performance Trade-Off
Contrary to the common perception that investors must “give up” performance to access liquidity and lower minimums, this chart shows evergreen funds outperforming closed-end funds over a three-year time horizon. While that outperformance is notable, the timeframes are important. We are still in the early days of evergreen fund performance and there is some evidence that evergreen funds post stronger performance in their first year, giving them a boost in the early years of performance.
Even so, the results offer an early but compelling signal: Evergreen structures have been competitive—and in this view, better—on near-term performance, even before accounting for their operational and liquidity advantages. At the same time, investors should be careful not to over-extrapolate from short horizons, and should consider which strategies work best for each fund structure.
April 2, 2026
Median Exit Markups During the Year Prior to Exit
Global Buyout Deals Exited from Q1 2019 - Q3 2025
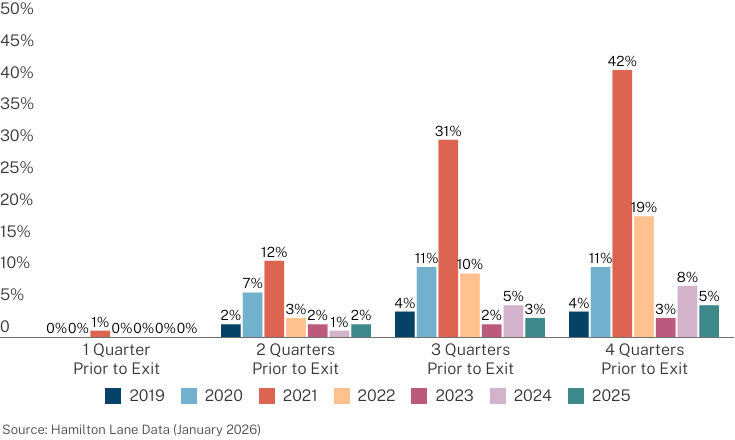
When Exit Markups Disappear...
Historically, one component of private equity returns has been the uplift between carrying value one to four quarters before exit and the final sale price. This uplift has averaged 10% - 20%, with some variance year to year. As this chart shows, that markup has largely disappeared for deals exited in 2024 and 2025.
If uplift at exit doesn't return, buyout deals may lose a significant source of their excess return potential. This will make it even more important for LPs to carefully assess a GP's value creation capabilities.
Read more in our 2026 Market Overview.
Corporate Finance/Buyout: Any PM fund that generally takes control position by buying a company.