Predictably Unpredictable: Demystifying the Road Ahead

Unprecedented. Uncharted territory. Like nothing we’ve ever seen before.
Seldom do any of those phrases actually hold true, particularly in the investment realm. However, when you look back at the historical context of the past three years from a macro-economic, geopolitical and financial market perspective, it sort of feels that way. Take a few recent phenomena: namely, trends toward de-globalization, economic decoupling, the impact of modern monetary policy, rapid inflation and nearly synchronized central bank rate policy movements. Not to mention, all of these happening concurrently over such an abbreviated period. At the very least, it seems like a once-in-a-generation string of events in the current context, so perhaps those terms are not too far off the mark.
Where Do We Go Now?
Not just a great line from one of the greatest rock songs of the late 1980s, but also a thought nearly permanently transfixed on investors’ minds. Let’s face it, we all want what we cannot have – we demand a greater level of certainty and predictability when it comes to our portfolios, especially in uncertain times. Alas, these are two rare attributes in the investing world.

Before trying to anticipate where we might go next, it might be useful to take a look back at how some of our “predictions” over the past few years have fared…
Looking Pretty Good!
Inflation
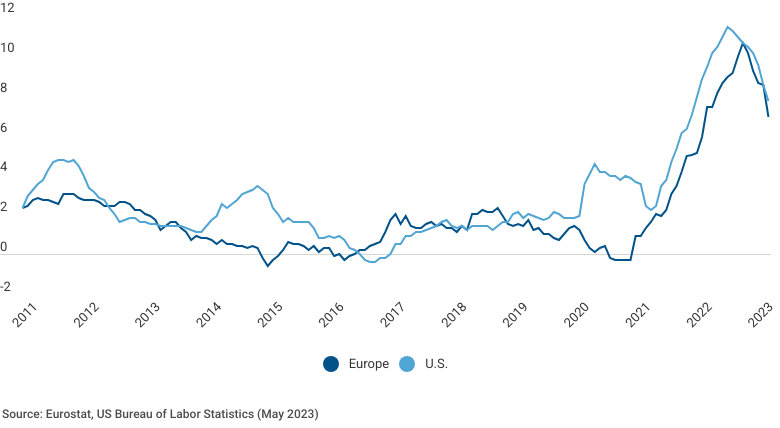
While still in the picture, it feels like the world has generally accepted the worst of inflation is largely behind us. In June 2022, with monetary policy actions and a global unwinding of post-Covid supply chain challenges, we believed inflation would start to taper. And it has, although as we said, it will likely remain “pesky” and elevated (along with interest rates) through the medium term. The trend continues to be your friend across most major economies in this area. Goods-related inflation, in particular, has come down meaningfully, but the housing market and service-linked inflation remains higher and stickier than central bankers would prefer.
Annual Inflation
Valuations
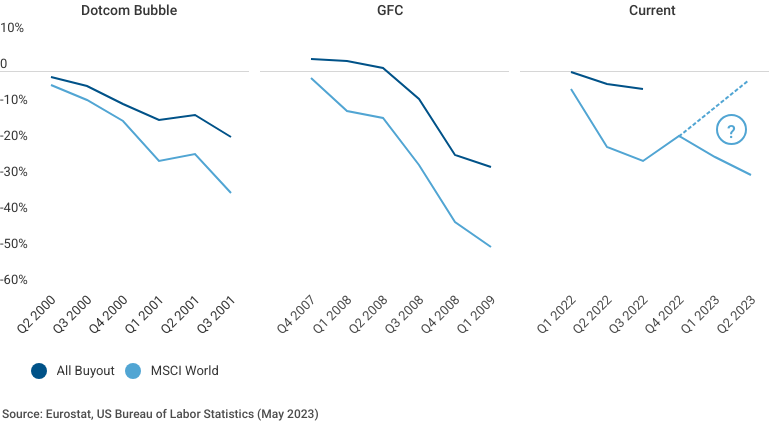
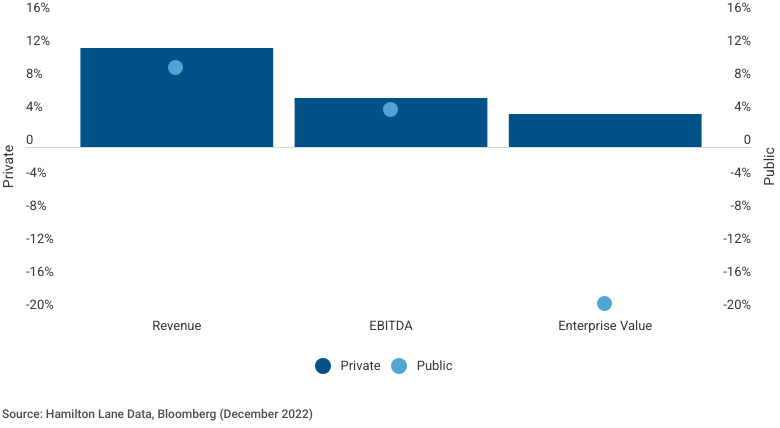
We were all waiting for the other shoe to drop on private market valuations. After all, when the public markets corrected ~20% in 2022, those “fictitious” marks from the General Partners in the buyout world would be soon to follow, right? Not so fast. As we have noted, the public and private market valuations are highly correlated (see below) and the fate of private market movements will largely be dependent on the direction of its more liquid counterparts.
Highly Correlated
Cumulative TWRS During Crisis Period
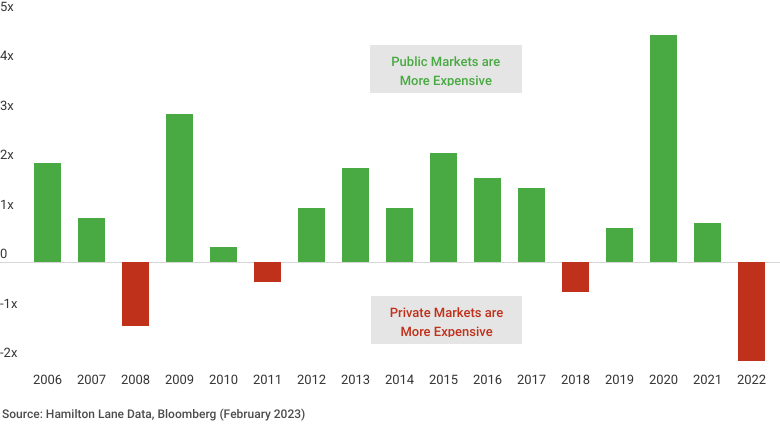
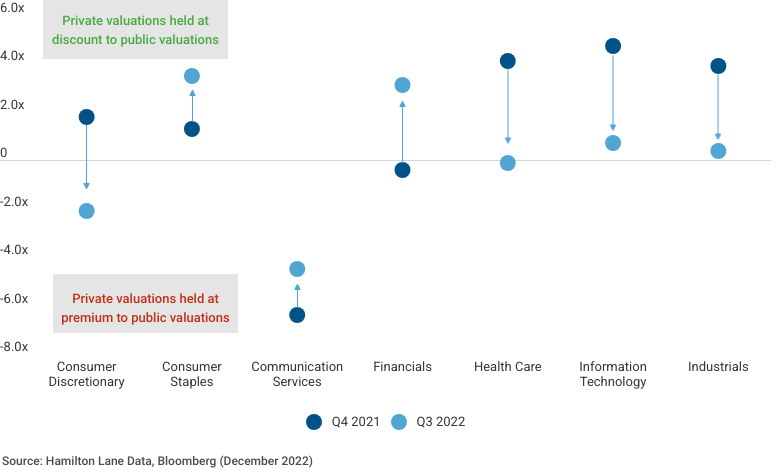
The explanation as to why these valuation/return movements are generally more muted in the private sphere is simple and straightforward. There are two core factors, the first being that private assets have generally been purchased at a discounted multiple to where a similar publicly-listed company in the same sector is valued. Dating back to the pre-GFC vintages, you can see that in 13 of 17 years, on average buyouts were completed at a discounted multiple to the equivalent public comparable company at the time. You also see that dynamic appear in the pre- and post-downturn marks for buyouts in the most recent 2022 downturn. Prior to the downturn, marks were generally held at a discount and became more aligned with public valuation multiples as markets corrected through 2023.
Buying “Cheaper” & Holding Values at a Discount
MSCI World Buyout Deal Purchase Price Spread
Difference in EV/EBITDA, Median by Deal Year
Private vs. Public Holding Valuations
By Sector, as of Q3 2022
The second factor contributing to lower observed volatility is operating performance. Given the governance model in the buyout realm – where the GP typically owns the majority of the company, controls the Board, and can directly implement strategic and financial initiatives – the long-term, active management private equity philosophy can produce stronger operating results and fundamental performance. Even in the context of relatively strong public market financial fundamental results over the past several years, below you can see that the buyout world (on an LTM basis) is still outstripping performance of comparable publicly-listed companies. While we aren’t saying that these metrics won’t face headwinds (particularly with stickier wage inflation and higher cost of capital), this does create a decent “cushion” to weather a pending economic storm and slowing demand. This facet of private markets investing also means GPs can directly control the structuring, utilization of leverage and timing of those elements in a unique way relative to public markets—where none of those pieces are true.
Fundamental Performance – YoY Growth
2022 YTD Through Q3
Other HL Predictions Where the Jury Is Still Out
Soft Landing Scenario: More Likely Than Not
As a reminder, our view, which has been largely contrarian until recently, is that we will experience a “softer landing” scenario in most major world economies. This dates back to late 2020 in our post-Covid papers, suggesting everyone should take a deep breath. Through 1H 2023, we have already seen the continued trend of reduced consumer spending, lessened business capex and slowing overall demand. This suggests that monetary policy actions – as well as recently tightening credit market conditions – are dampening growth, with most major economies now expecting a recession over the next 12 months.
That said, corporate margins, growth fundamentals as well as both corporate and consumer balance sheet health remains strong relative to historical periods. These statistics also compare favorably to other historical periods just prior to past downturns. The employment market globally remains strong, especially with recent job numbers in the U.S. continuing to surprise to the upside. We have also spared you one of our favorites, the inverted yield curve chart, which is a perfect seven out of seven over the past 50 years at predicting a pending recession when it becomes inverted (as it did this past year). Thus, our view is that these factors continue to point to a milder recession in most developed nation economies. For the U.S. that likely is a 2H 2023 event and has likely already begun within Europe. APAC and ROW will be more of a mixed bag. The next six months will be telling in this regard.
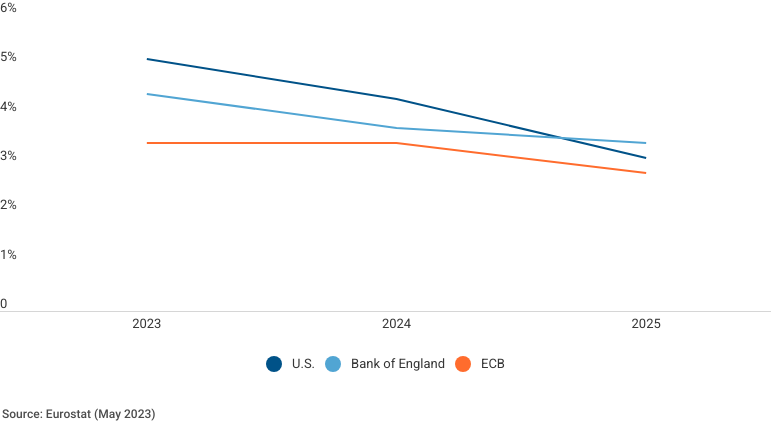
Interest Rate Plateau
Directly tied to inflation, the pivot in interest rates has had a meaningful impact on asset price valuations across all markets, both public and private. Rightfully so, this continues to be a focal point for investors in terms of predicting the “economic future.” It also plays a key role in our soft landing prediction, as we believe it will be closely tied to central bank interest rate policies. Last fall we commented that short rates would peak “around 5.5% in the first half of 2023” and then plateau for several quarters before gradually shifting course, as the U.S. Fed and others were trying to thread the needle of dampening demand enough, but doing so in a way that didn’t create an even more challenging recovery – or the dreaded hard landing – once the economy tipped over. Our expectation is that there will be a pause on additional rate hikes over the next month or two. And rather than a sharp reversal to more dovish monetary policy, we are likely to see a shift to neutral as central bankers want to avoid the teeter-tottering, or a rapid reversal of rate movements over abbreviated time horizons, similar to what transpired throughout the 1970s via quickly rotating rates. Those policies ultimately fueled the hyper-inflationary environment of the 1980s and central bankers have presumably learned from those lessons of the past. So, expect rates to remain elevated through the next 24 months. That view now seems to be the market consensus.
Forward Interest Rate Forecasts
Tactical/Thematic Investing Matters More Today
Expect a greater dispersion of outcomes going forward – by strategy, sector, geography, etc. It will be more of a deal pickers’ market. In our paper on inflation from 2021, shorter duration, yield-oriented, visible and diverse portfolio acquisition were just a few of the areas we said would fare well in the current context. We also said that private credit, secondaries and infrastructure could be compelling tactical tilts. Each of those strategies have been strong performers over the past two years in particular, but more importantly, the outlook and secular supply/demand dynamics have never looked better in those areas. Check out what my talented colleagues are saying lately on private credit, secondaries and infrastructure.
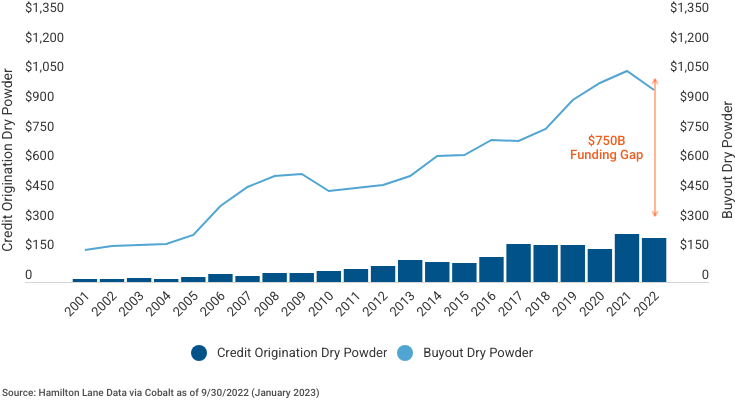
One recent addendum to call out expanded opportunity in particular - look no further than private credit, where today there is an even more attractive picture compared to less than a year ago. Specifically in the U.S. – the broadest, deepest credit market – small and regional banks account for about one third of assets in the banking system and roughly 40% of lending activity, per the Federal Reserve. That equates to approximately $4.5 trillion of commercial bank loans and leases from those institutions. So, even a small drop off in those levels, say, a reduction of 10-15% due to increased regulatory velocity and capital adequacy requirements, could raise the current private credit funding gap per the chart below by over 50% if other capital sources don’t fill the void.
Pre-SVB/FRB Private Credit Funding Gap
USD in Billions
Predictive Valuation Movements | Is the Worst Behind Us?
Have we already seen a trough in private market valuations? A big part of that answer will be dependent on your view of where public markets will move – because as we explained above, the two are heavily correlated. One of the drawbacks of the private markets asset class is the lag in reporting – typically 45-90 days post-quarter end – to when managers publish their values. For the past five years we have published an early, quarterly predictive model thanks to our dedicated quantitative analytics team and uniquely granular, daily cash flow data on this asset class. Now, take your time machine back to the end of Q4 2022, after a rough year in the public markets. The sentiment at the time was that this would be the quarter private markets would simply HAVE to drop. Our model, published in the first week of January, suggested otherwise.
2022 Buyout Estimated Quarterly Returns vs. Actual
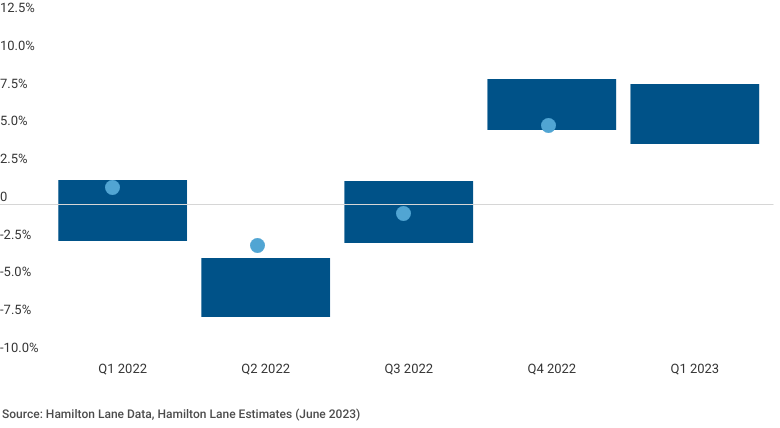
As the Q4 marks have come in over the past few months, the data has landed toward the lower end of our predictive range.
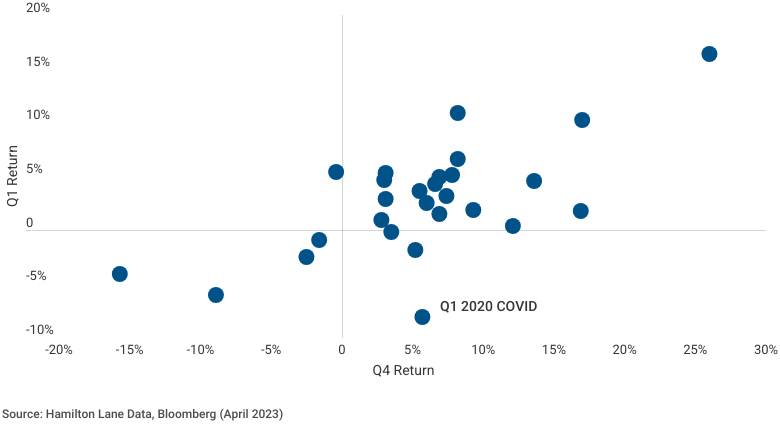
What about Q1? The official Q1 valuation data should be finalized soon, and in addition to a similar modestly positive trajectory expectation for the quarter ending this past March, we also looked at historical data showing sequential quarterly change data from Q4 and Q1 movements. This data can behave somewhat differently post-downturn, in a higher rate environment and in coming off trough levels. The sequential quarters Q4/Q1 also tend to have a very strong correlation. Thus, our view based on the predictive analysis is that you will see more of the same with Q1 movements: modestly positive average performance on a quarter-over-quarter basis in the buyout world.
Private Equity Q4 Returns vs. Subsequent Q1 Return
One Last Prediction Before You Go
A key benefit of the maturing of the private market space is that it is no longer an asset class with only a couple of strategy options. It’s really not your parents’ asset class anymore. The here and now of choices, strategies and structures continues to evolve positively for investors. The other major facet is that there is now a well-documented body of work, with greater evidence of what to expect in terms of performance, liquidity and risk within this space. We provided much of that detail last summer in our paper titled, “Today’s Markets: Loaded For Bear”.
It is not really a debate anymore. Private market strategies tend to outperform public market equivalent strategies over longer periods of time. Not to mention the landscape of private companies – defined by generating at least $/€/£ 100mm of revenue – is nearly 10x the size in terms of number of choices as an investor. Those dynamics, along with the performance data, make it a hard trend to bet against. Some have been even more bold with that prediction…

There are a number of factors that can affect the private markets which can have a substantial impact on the results included in this analysis. There is no guarantee that this analysis will accurately reflect actual results which may differ materially. These valuations do not necessarily reflect current values in light of market disruptions and volatility experienced in the fourth quarter of 2020, particularly in relation to the evolving impact of COVID-19, which is affecting markets globally.
The information contained in this presentation may include forward-looking statements. Forward-looking statements include a number of risks, uncertainties and other factors beyond our control which may result in material differences in actual results, performance or other expectations. The opinions, estimates and analyses reflect our current judgment, which may change in the future.
All opinions, estimates and forecasts contained herein are based on information available to Hamilton Lane as of the date of this presentation and are subject to change. The information included in this presentation has not been reviewed or audited by independent public accountants. Certain information included herein has been obtained from sources that Hamilton Lane believes to be reliable but the accuracy of such information cannot
be guaranteed.
This presentation is not an offer to sell, or a solicitation of any offer to buy, any security or to enter into any agreement with Hamilton Lane or any of its affiliates. Any such offering will be made only at your request. We do not intend that any public offering will be made by us at any time with respect to any potential transaction discussed in this presentation. Any offering or potential transaction will be made pursuant to separate documentation negotiated between us, which will supersede entirely the information contained herein.
The information herein is not intended to provide, and should not be relied upon for, accounting, legal or tax advice, or investment recommendations. You should consult your accounting, legal, tax or other advisors about the matters discussed herein.
Hamilton Lane (UK) Limited is a wholly-owned subsidiary of Hamilton Lane Advisors, L.L.C. Hamilton Lane (UK) Limited is authorized and regulated by the Financial Conducts Authority. In the UK this communication is directed solely at persons who would be classified as a professional client or eligible counterparty under the FCA Handbook of Rules and Guidance. Its contents are not directed at, may not be suitable for and should not be relied upon by retail clients.
Hamilton Lane Advisors, L.L.C. is exempt from the requirement to hold an Australian financial services license under the Corporations Act 2001 in respect of the financial services by operation of ASIC Class Order 03/1100: U.S. SEC regulated financial service providers. Hamilton Lane Advisors, L.L.C. is regulated by the SEC under U.S. laws, which differ from Australian laws. The PDS and target market determination for the Hamilton Lane Global Private assets Fund (AUD) can be obtained by calling 02 9293 7950 or visiting our website www.hamiltonlane.com.au.
Hamilton Lane (Germany) GmbH is a wholly-owned subsidiary of Hamilton Lane Advisors, L.L.C. Hamilton Lane (Germany) GmbH is authorised and regulated by the Federal Financial Supervisory Authority (BaFin). In the European Economic Area this communication is directed solely at persons who would be classified as professional investors within the meaning of Directive 2011/61/EU (AIFMD). Its contents are not directed at, may not be suitable for and should not be relied upon by retail clients.
As of June 12, 2023