2025 Mid-Year Market Update


We all thought BB King was singing about a love affair. But he wasn’t. He was singing about the private markets in late 2025. Remember those days not so long ago when we thought our love for private markets would last forever? Ah, romance! Those heady days in 2021 when distributions were coming so fast that we thought we had found the endless fountain of money. Those wonderful times when deals fell out of the sky and did so well so fast that we knew we were King Midas. Oh, how money talked…the heady feeling in 2023 when private markets so easily outperformed public markets that we counted basis points by the thousands. The giddy days in 2022 when investors instantly answered our texts and calls with commitments. Those times when everyone thought private credit grew to the sky and we would soon be walking to the corner savings and private credit union to see about our home loan.
Now?
Investors wonder if they’ll ever get their money back from their private markets investments. Returns? Let’s just say private equity managers find that the word “returns” causes them to find a sudden interest in what the weather will be over the next few days. The media is filled with stories of the end of private credit as it deals with lower returns and an impending sense of defaults. Fundraising is so difficult that managers are hoping the U.S. loosens rules for retail investors and they can raise money from a cohort that has never heard of them before. Publicly-listed private market managers are watching the public market averages reach new highs while their own stock prices find new lows. That’s never a good sign, is it?
Was BB King right? Has the thrill gone away for good? Is the era of private markets over? Let’s spend a few minutes and take a look at the data to see what’s actually happening in the private markets. If you've read our materials before, you know we thought that previous unquestioned ardor for all manner of private markets investing was not warranted. Do we feel that faded love affair today can be resuscitated?
Let’s take a look…
Distributions
The most consistent question we get asked in almost every meeting in every part of the world today is, “Do you expect distributions to increase materially in the next 6 to 12 months?”
{Actually, we lied. That isn’t the most asked question. This is.

This update might be 6 7.}
Has the lack of distributions been exaggerated?
Annual Private Equity and Credit Distributions
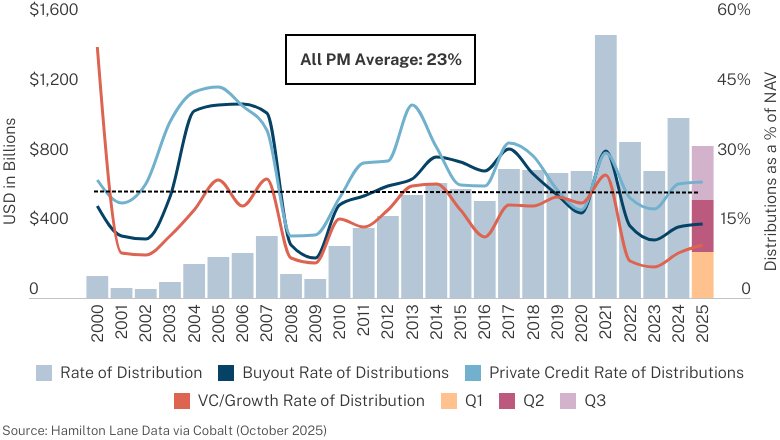
If you go by absolute numbers, distributions are on pace to be the second highest on record. That seems good, doesn’t it? It’s why every time you ask a general partner why they haven’t given any money back, they say, “I have. I have given you $100 this year and that’s more than I gave you before." What they fail to mention is that you have given them $1,000 and so, as a percentage of private markets’ increasing NAV, you are not getting much back. You can see that distributions in buyout and VC, while marginally better, are near record low levels as a percentage of NAV. Credit is around average levels, but it never fell too low in this cycle.
The difference between what is happening now and what was happening in 2021, in those days when we couldn’t bulk up our portfolios with enough private equity, is striking.
Buyout Distributions as % of Fund Size by Fund
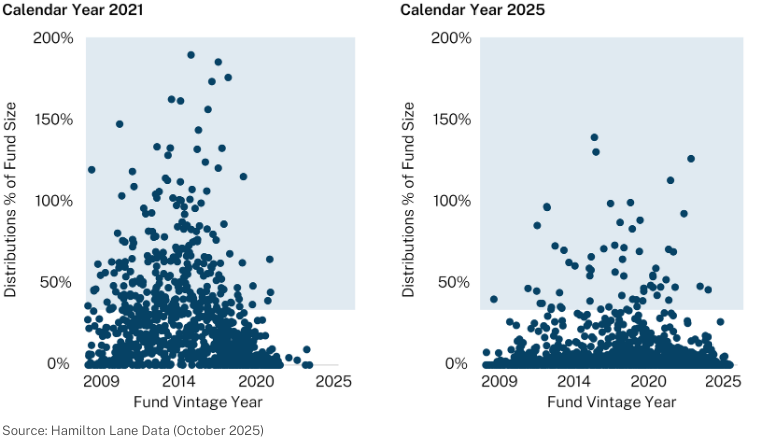
We’re simple people. We like dots... and connecting them. What stands out here is how much less frequently you are seeing large distributions relative to fund size. The big winners are not as frequent. That’s the bad news. The good news is that, while you might think that there are no exits in the private world, that is not true. There just aren’t as many as before and not enough in the context of the growth of everyone’s portfolios over the last few years.
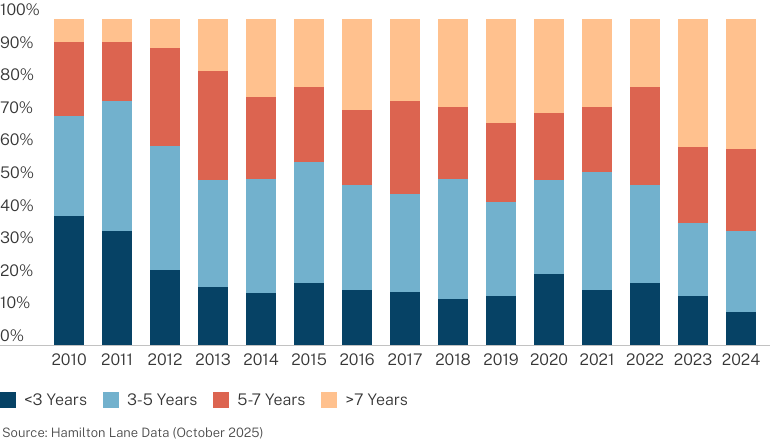
Not surprisingly, holding periods for buyout and growth equity have increased.
Holding Period of Exited Buyout Deals
% of Deal Count by Year of Exit
Holding Period of Exited Growth Equity Deals
% of Deal Count by Year of Exit
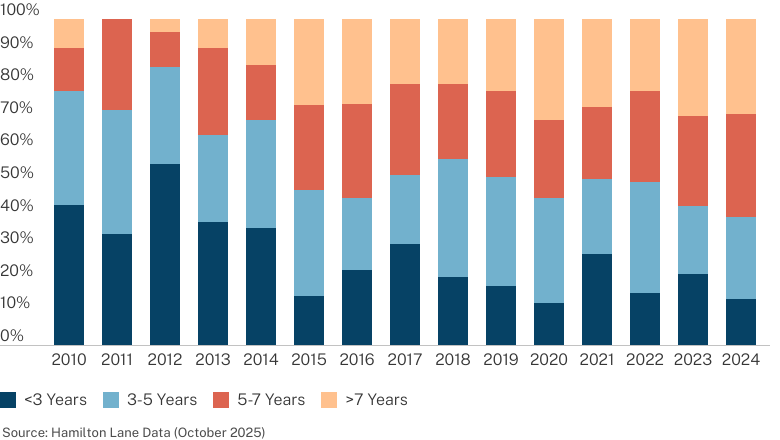
Look at the taupe-colored bars (colors have the greatest names, don’t they? You just can’t make up a word like “taupe." We’re not even sure we’ve identified the color correctly but just liked the sound of the word). Those are deals held over seven years and make up a growing percentage of exited deals. The dark blue bars, deals held under three years, have, over the last fifteen years, moved inexorably toward zero. (We hope it never gets less than zero…) This trend of longer holding periods will result in lower IRRs. I know some will tell you that’s not true, that the returns will compound enough to push IRRs higher.
Don’t believe them.
The good news, though, is that it’s also not true that portfolios are filled with companies that can’t be sold. If companies held longer than seven years are being sold at that high a percentage, then money is coming out of older portfolios and the companies must be doing relatively well.
Another concerning sign regarding exits is the value of the exits relative to holding values.
Median Exit Markups During the Year Prior to Exit
Global Buyout Deals Exited from Q1 2019-Q1 2025
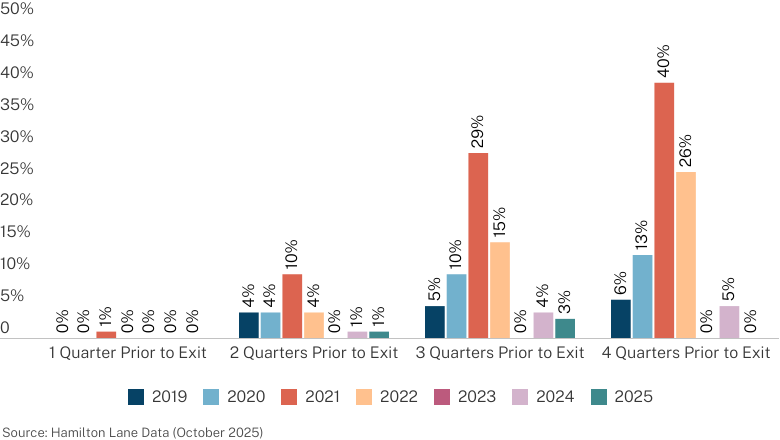
One of the great hidden values in private equity portfolios is that exits have generally been at higher prices than the NAV of those assets three or four quarters before the exit. (And, no, this doesn’t mean they were (wink, wink) held at lower valuations to trick us all. It means that most valuations do not take control premiums into account. In addition, you can see that the valuation to exit delta narrowed as exit date approached, presumably as valuations were moving up to reflect likely deals). Those exit markups have essentially disappeared over the last three years. Not good.
What is our answer to the question, “Are exits going to increase a lot soon?”

Perhaps we aren’t that blunt in polite circles, but you get the idea. Why don’t we think there will be a wave of exits? One reason is the difference between holding values and the market.
Deals purchased in 2021 and 2022 are being held at valuations that aren’t currently clearing
EV/EBITDA of Unrealized 2021 & 2022 Deals vs. 2024 & 2025 Purchase Prices
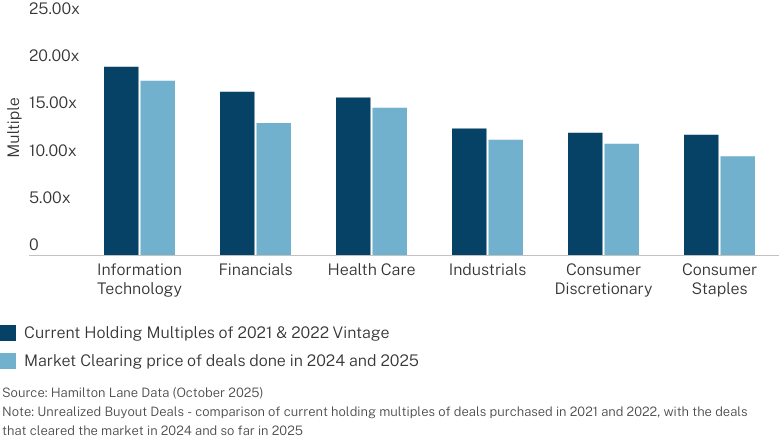
This could be the most important chart in this narrative. It looks at the current holding multiples of deals done in the 2021 and 2022 vintages, generally regarded as deals that were most overpriced at acquisition. It compares those multiples to the multiples on deals that were done in 2024 and 2025 in those industries. Without exception, current holding multiples are higher than deals that were done. Not dramatically so, perhaps a multiple turn, but enough to make buyers and sellers apart enough on price to prevent a deal. In order for an avalanche of deals to happen, we will need to see sellers drop prices or buyers meet those higher valuations. We expect that some back and forth will occur, but not enough to clear the substantial NAV these figures represent.
{Here’s a teaser for our full 2026 Market Overview: Our early data indicates that these deltas are compressing and it’s because buyers are capitulating, not sellers. Score one for the “assets aren’t overvalued” camp…}
Aha, you say! This proves valuations are not accurate and overvalued. Perhaps. Or, perhaps it means general partners are holding high-quality assets that they don’t want to sell at prices buyers are looking for today. Perhaps it means buyers are asking for a large discount to account for uncertainty and sellers believe that sentiment will fade. The data indicates that, in fact, buyers in the 2021 and 2022 vintage have assets that are performing and that multiples have continued to increase.
Performance
We are asked over and over what will improve the performance of private equity and private markets. Let’s look at rolling three-year performance.
Buyout 3-Year Rollings TWRs
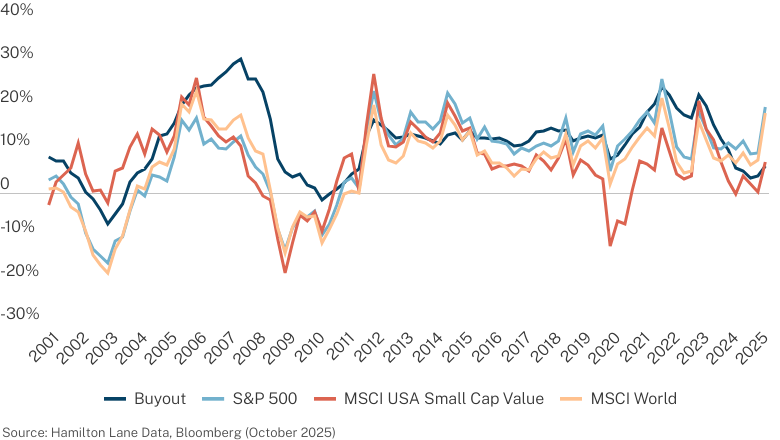
At this point, private equity is underperforming every public index we use. This is unprecedented! (It has to be, we’ve seen that word used in this context in numerous publications.)
Well, guess what? It’s not. Look at the dark blue line (buyout returns) in that spaghetti line period around 2014. Yup, 2+ years of underperformance and, at one point, against all indices. It’s rare, we’ll grant you that one, but it happens. Interestingly, the three-year return numbers are comparatively worse.
1, 3 & 5-Year Private Equity Performance
Annualized Time-Weighted Returns as of 6/30/2025
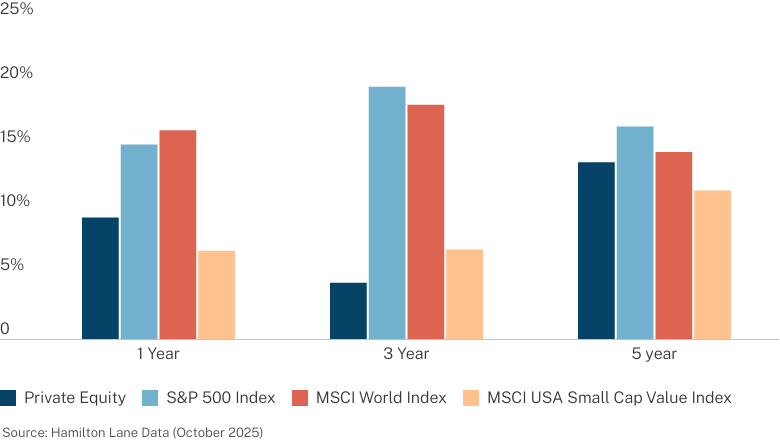
Private equity underperforms across the one-, three- and five-year periods, but the three-year is particularly dismal. We won’t sugarcoat this data. Private equity needs to get its act together and return to outperformance. Investors aren’t paying high fees and getting less transparency and liquidity, so they can say they “only” underperformed by a few hundred basis points.
What will change this underperformance? Some of it may have nothing to do with how public equity performs.
Performance by Public Market Regime
All Private Equity Average 4Y Excess Return By S&P Return Regime
We show this chart all the time. Private equity’s outperformance of the public markets is almost inversely correlated to public market performance. When public markets are racing ahead with 10%, 15%, 20% numbers, private equity struggles to keep up. That is exactly what we have been seeing the last five years in the public world. Will that continue?
Forward P/E and Subsequent 5-Year Annualized Returns
S&P 500 Total Return Index
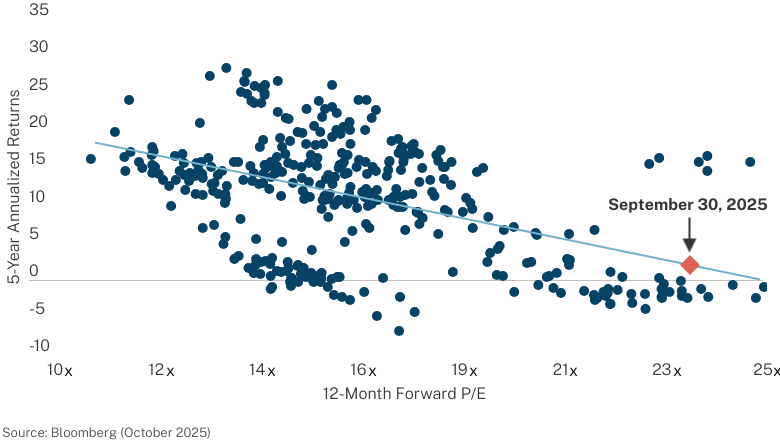
We are not particularly good at predicting market returns. (We know, we say we are, but we have to because everyone says they are.) But there is a statistically significant historical correlation between forward price-to-earnings ratios and go-forward S&P returns. Right now, you can see where that burnt orange diamond is located. It says future S&P returns are unlikely to be as high as they’ve been the past five years.
Take a look at the cluster of six blue dots directly above the orange diamond, which represent the six most recent data points in this sample – returns after the COVID era, starting from April 2020-September 2020. This is the only time in history that price-to-earnings multiples have been north of 22x and returns have been anywhere close to this level. Wow. Do we think this is the start of a new pattern, or a historical anomaly due to a global pandemic?
It is important to note that the performance issue in private markets is very much a function of private equity.
3-Year Cumulative Return
Cumulative TWRs Q2 2022-Q2 2025
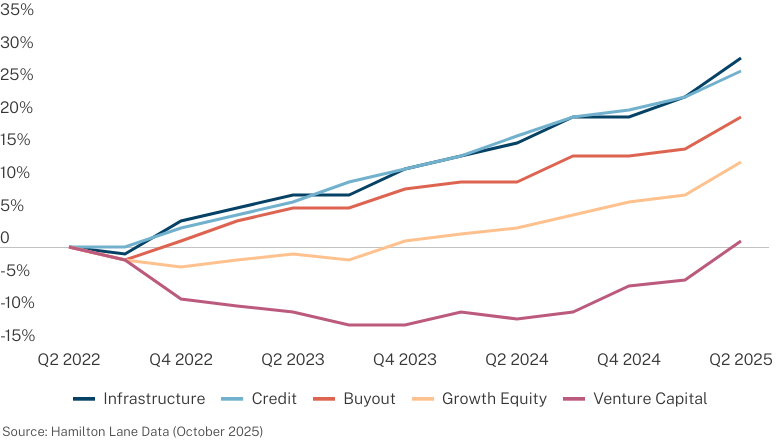
Private equity—buyout, venture and growth—have been the laggards. That is not true of private credit and infrastructure. This idea that all private markets strategies are struggling is inaccurate.
Performance—long term
We know everyone says that they are long-term investors and don’t really focus on the short-term.

Humor us, though, and pretend that you are in private markets for the long term. Let’s use ten years as the normal span for measuring longer-term performance.
10-Year Asset Class Performance
Annualized Time-Weighted Return as of 6/30/2025
Even over ten years, you can see the S&P outperforms private equity. But not by much and private equity handily outperforms other indices. Private credit remains a star, easily doing better than any benchmark. Private infrastructure is also doing well.
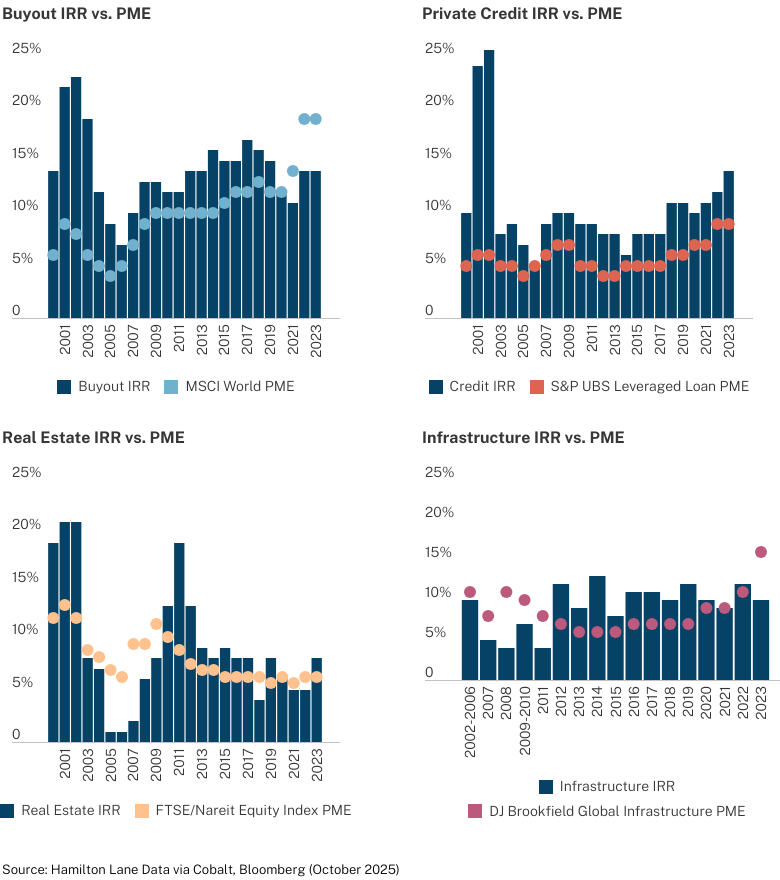
Vintage year is the normal classification for private markets performance.
{Interesting question to no one in particular: If evergreen funds become the more accepted way of investing in private markets, will we ever care about vintage year numbers?}
Buyout has outperformed in every vintage year except 2020-2023. We don’t bet, but, if FanDuel had a private markets betting pod, we’d place a bet that, in five years, buyout will outperform in every vintage except, maybe, 2022. Private credit remains undefeated. It has never underperformed. Never. Infrastructure and real estate also look awfully good against public benchmarks.
All Private Equity 10-Year Rolling TWRs
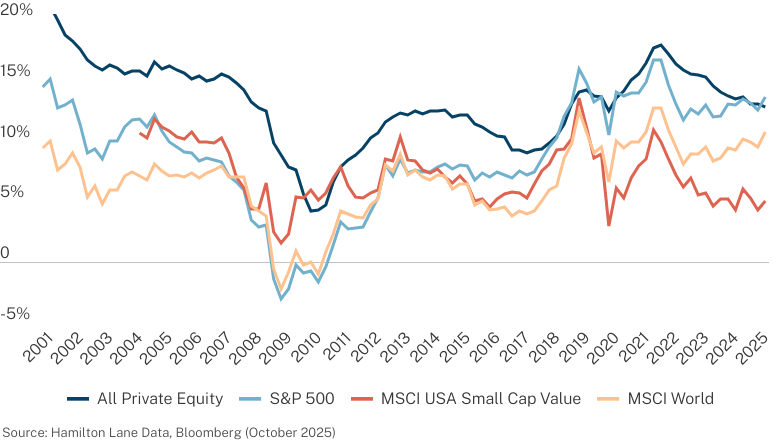
We like this rolling performance chart more than any other when comparing performance because it does not pick a static moment in time. Private equity has dipped below the S&P but remains above other indices. Equally important, you can see from this chart that private equity has underperformed public indices for periods, but they were brief, and it has outperformed for most of the last 25 years.
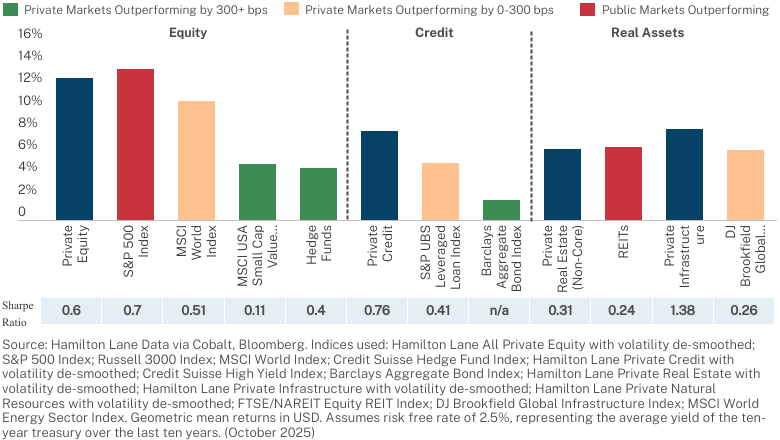
Highest and Lowest 5-Year Annualized Performance
2000-Q2 2025
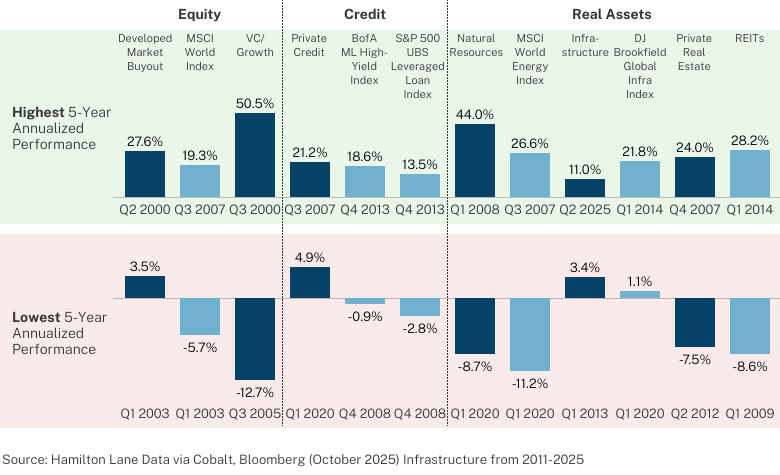
Maybe this is the most important chart in this update. We know that there is a great deal of attention paid to the risk of private markets. If risk is defined as risk of loss, it’s overstated. You really have to work hard, and incompetently, to lose money in private buyouts, credit and infrastructure. That’s a nice cushion to have. Plus, if that wasn’t enough, you aren’t giving up any upside. Your best periods in buyout and credit are better than what you get in the public markets.
Fundraising
Distributions, performance, now fundraising… we march through the Valley of Private Markets Death. Is there a sadder sight than a private markets manager bereft of funds?
The data don’t lie.
Global Private Markets Fundraising
By Vintage Year
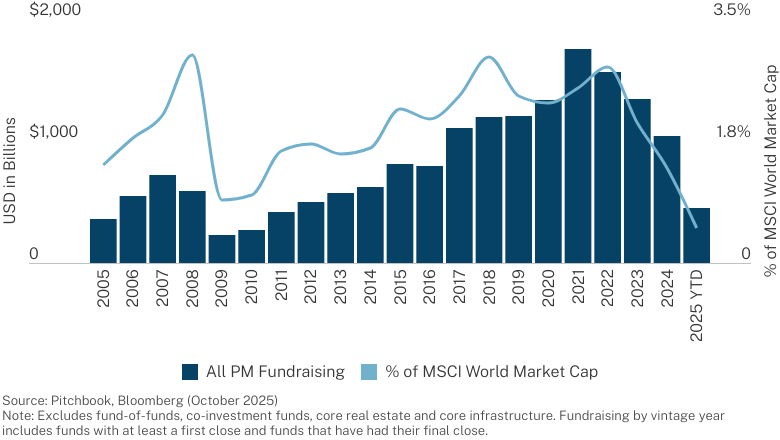
Fundraising may fall for the fourth straight year. Sure, there are other things going on such as evergreen fundraising and increased co-investment capital being deployed, none of which are reflected in these numbers. But, again, this isn’t that hard. If you have an industry where (a) you are underperforming your benchmark for almost three years and (b) you are not returning adequate capital to the investors you are counting on to give you more capital, what do you think is going to happen to fundraising?
What is interesting about fundraising is that you would expect that the decline means smaller funds for everyone. Nope.
Median Step Up by Strategy
Vintage Years 2005-2024
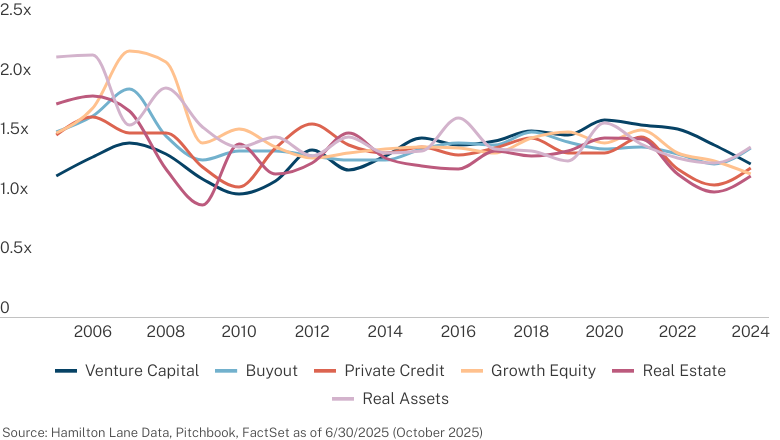
If the number is above one, it means fund sizes are increasing. The step-ups haven’t been as marked as prior years, but they are still, on average, getting larger. Does this mean the only groups getting funded are those that can raise, and others simply aren’t raising a new fund? Does it mean that the fundraising decline is really hitting ancillary funds and not flagship funds? You might need to wait for our full Market Overview in the spring to find out. (Assuming we find out…)
It is striking to see how normal it is for fund sizes to increase.
Historical Fund Step Up Percentages
Percent of funds that have increased in size from their predecessor
Buyout Funds, Vintages 2005-2024
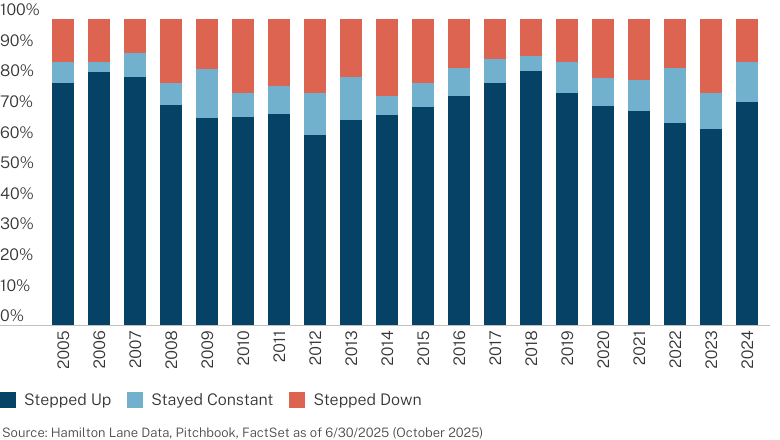
You’re generally in the 70% to 80% range for the percentage of funds in any vintage year that get larger. That’s been true for the past 20 years and doesn’t show much sign of diminishing. That is hardly an indicator for a struggling industry. Perhaps we are simply going through a normal phase for any growing industry where we are winnowing out the winners and losers.
Investment activity
Is there any end to this array of data showing an industry performing at levels below average? This next set of data is so-so.
Annual Private Equity and Credit Contributions
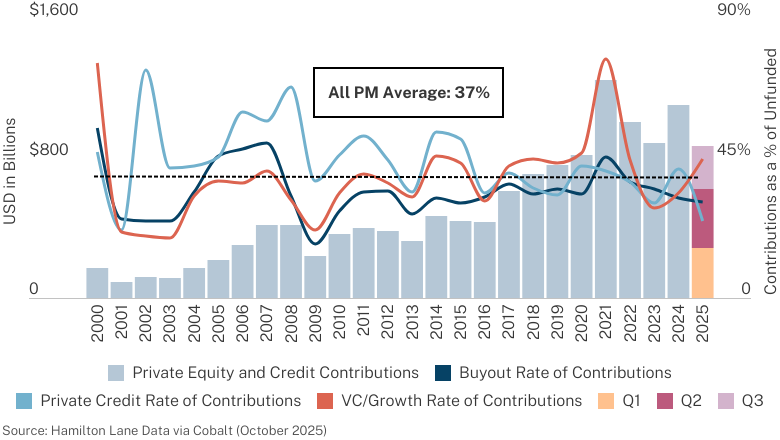
Credit and buyout aren’t doing much other than normal levels of activity, but look at venture. It is trending into active territory. Why?
AI Venture Capital Deal Activity
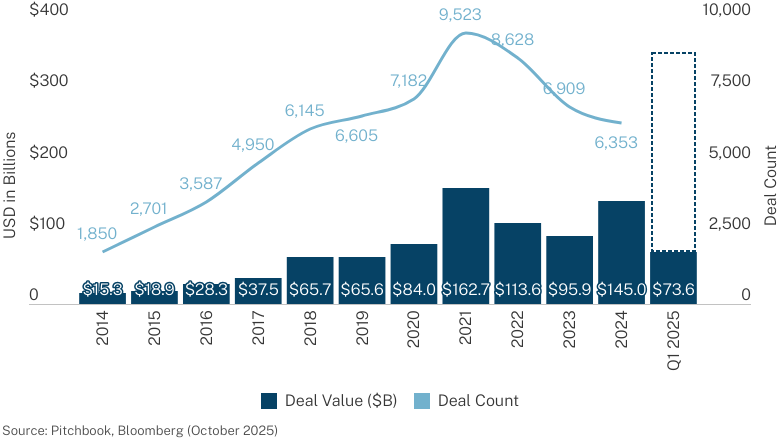
This cannot be a surprise to anyone. The venture area is becoming dominated by AI as an investment opportunity. Over 50% of deal volume is attributable to AI. If this pace continues, venture capital AI investment will be 2x larger than it has ever been, and that is in a year when overall fundraising is only a fraction of the 2021 peak for AI investment. I suppose that’s pretty diversified when you consider how much of your public equity exposure is attributable to AI. We know, this means it’s a bubble, right?
(We will note that we hear something is a bubble by someone who is not invested in that space and has missed a huge bull market.)
Time to $30M Revenue (AI vs Historical SaaS)
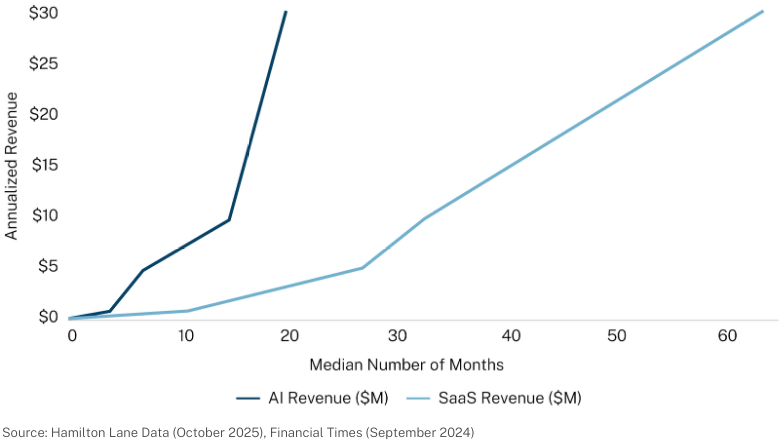
The difference this time with AI is that we are dealing with companies that are generating revenue at far faster rates than similar areas where there was a great deal of investment activity. Recall how appealing SaaS was as an investment thesis and how much money was made in the area. The speed at which these AI-oriented venture companies are scaling dwarfs prior comparisons. We know... this doesn’t mean you will make money as valuations are also high. We also know this doesn’t mean the revenue will continue or that any of these companies will ever be profitable. But, let’s use some perspective here. When you invest in venture, you are inherently investing in high risk, high reward assets. What seems to make AI more appealing is that the risk is not quite as great as you have seen in prior cycles of new products and investment arenas.
Let’s look at another area everyone tells us is in a bubble, secondary investing.
Secondary Market Transaction Volume
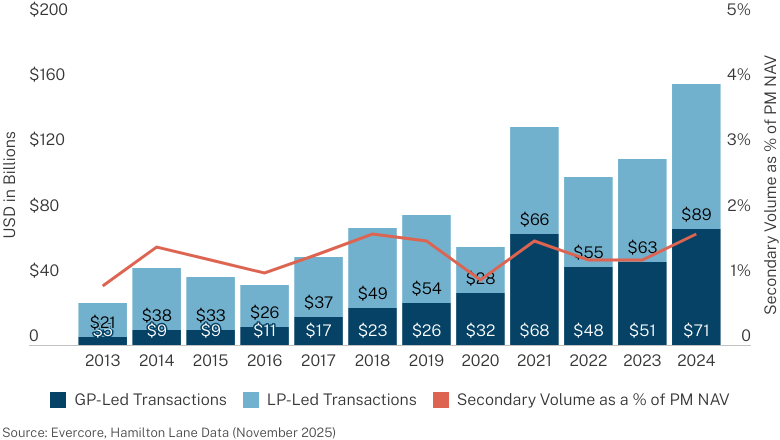
We’ll keep this simple. Deal volume continues to increase. Is that a sign of a frothy market? We suppose it would be if NAV, both in LP and GP portfolios, wasn’t rising at a faster rate than secondary deal volume.

It is hard to tell yourself with any seriousness that you are in a bubble when the rate of growth of investing activity is so far behind the rate of growth in the very assets you are trying to invest in with secondaries. We’ll delve into this more in our full Market Overview but, right now, go buy some bubble mix, take a deep breath, blow, and watch what real bubbles look like.

OK, we have to deal with it, the chart that, in our view, gets an inordinate amount of attention. Purchase price multiples.
Purchase Price Multiples at Acquisition
Buyout Purchase Prices, Median EV/EBITDA by Deal Year
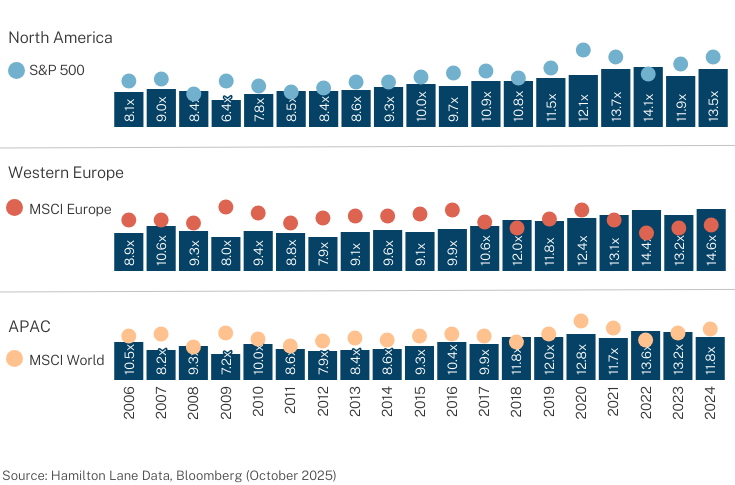
We have heard for the last ten years that prices are “too high.” (We’ll say that we’ve actually heard it for the last 30 years, but then we’d have to admit how old we are and how long we’ve been doing this.) We have always assumed that has meant they are too high to make any money. It has never been true, but that hasn’t stopped the statement from being made. Now, with buyout returns lagging the public markets, we hear the statement in all its corollary glory. “See, prices have been too high for buyout to achieve its return targets." Maybe, but when we look at this chart, we don’t see much that has changed over the years. Curiously, for example, European buyout multiples are higher than public multiples have been for a long time, and European buyout has still done well. If you think U.S. multiples are too high, then you might consider selling your public equity as those are higher.
Don’t get us wrong; we look at multiples and prefer lower prices. But, remember, if multiples really decline, you might want to think about what that does to your existing portfolio.
Macro outlook
You didn’t come to a private markets mid-year outlook to get our view on the macroeconomic outlook. (We actually suspect you did because, well, both you and we know that

It’s true.)
We know you are inundated with tomes from banks, from financial services firms, from random strangers, telling you what is going to happen on a macro level. Our advice: Throw most of it out. It’s boring, repetitive and wrong. (The boring part is the greatest sin of all.)
We won’t leave you empty here. We’ll give you soundbites that you can agree or disagree with and give you some framework.
- The only macro question that matters is what happens economically in the U.S. That’s not a home country bias we have; it is just the reality of the world today.
- U.S. economic policy will, for at least the next three years of the Trump administration, be characterized by uncertainty and shifts in direction as they are largely dependent on the goals and desires of a very small group of people making decisions.
- U.S. economic direction will be determined by the continued growth (or lack of it) of spending for AI infrastructure and implementation.
- Continued AI spend will mean the U.S. is the most attractive investment location, by far. It means higher-than-expected U.S. growth, interest rates and inflation. U.S. equity markets will continue to increase.
- Reduced AI spend will mean the U.S. will enter a recession, with lower rates. The rest of the world will also experience reduced growth.
- Gold and, perhaps, cryptocurrencies will continue to be attractive as investors lose faith in the government’s ability/willingness to curb spending.
There, go forth and prosper.
There is one piece to the macro puzzle that is particularly important for investors—currency movements. We say that knowing that U.S. investors don’t care about the value of the U.S. dollar. But, everyone else does.
We’ll save a longer dissertation on how to think about currency impact on your private portfolio for our annual Market Overview. (We call that a teaser in the market outlook business.) We U.S. investors only focus on U.S. dollar returns, but that S&P investor outside the U.S. isn’t generally seeing eye-popping returns. In fact, Euro-based investors, in particular, only get remotely comparable returns investing in their own currency. And hedging?
Hedging simply costs too much, and you are probably better off not hedging.
End of U.S. dominance
We get this question all the time. Given U.S. economic and political events, is the era of U.S. dominance over? For this discussion, we assume U.S. dominance means the U.S. as the preferred location for investment, both for safety of capital and returns. From a macro perspective, the answer is easy.

Look at the data on foreign ownership of U.S. equities. It’s at all-time highs. For private markets, particularly private equity, the answer is a little more nuanced.
Private Markets NAV Evolution by Region
From Q1 2000 to Q2 2025
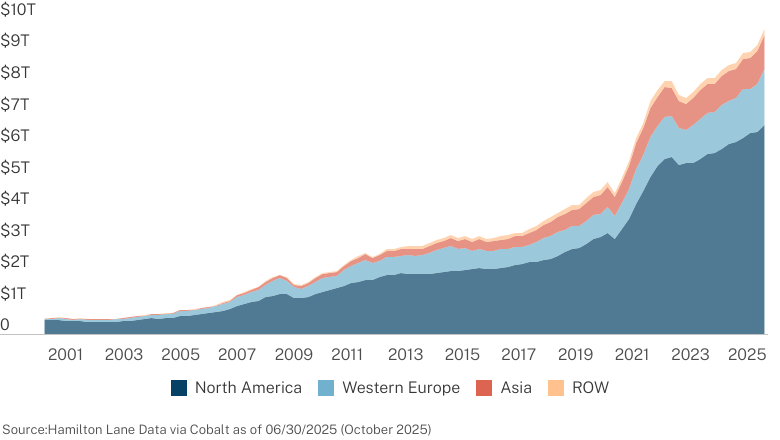
It has long been the case that private markets have been dominated by North American (essentially U.S.) activity. Given that structure, the overall picture is unlikely to change any time soon. We hear, anecdotally, that there is more interest in European managers, and it comes from two sources. One is U.S. funds, many of which are under-allocated to non-U.S. funds and are looking for more diversification. The second is from large Chinese investors who are geopolitically constrained from U.S. investments. We have two comments on that anecdotal evidence.
- It is focused on a very small number of non-U.S. managers. It is primarily those who are large enough to absorb those allocations. That is a key consideration of ending U.S. dominance of the private markets. The opportunity set, particularly for institutional-grade managers, will grow slowly.
- We recommend that those non-U.S. managers receiving inbound interest from U.S. and Chinese investors quickly convert those queries to commitments. We have a prediction.

U.S. dominance in the public markets has been predicated on better equity performance. Is that the case for non-U.S. private performance?
Growth of $1, if invested in 2018 vs Private Equities
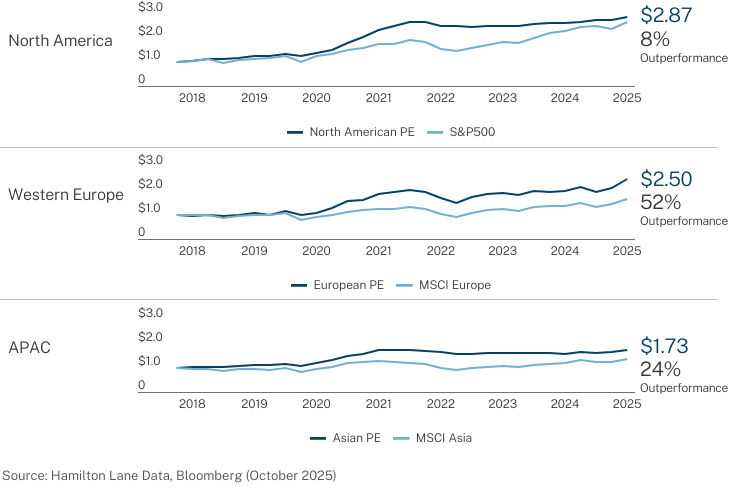
Interesting, isn’t it? European and Asian private equity have far outperformed their local benchmarks over the last eight years compared to how U.S. private equity has performed against a U.S. benchmark. It’s not even close. But, here’s the test that tells us whether you are reading any of this…

You do see it, right? It is what makes us skeptical that U.S. dominance will fade. Look at those pesky return numbers on the left side of the chart. U.S. private equity, while struggling against its U.S. public benchmark, is still the best performing private equity in the world. That is what drives investors to the U.S. and what will continue to drive them there (even if they are doing it in vehicles that are more expensive because of tariffs).
This analysis does, however, not take into account the impact of currency. This could reduce the flows into U.S. private markets and be a factor in reducing U.S. dominance of the industry. But another factor could be the stability of returns.
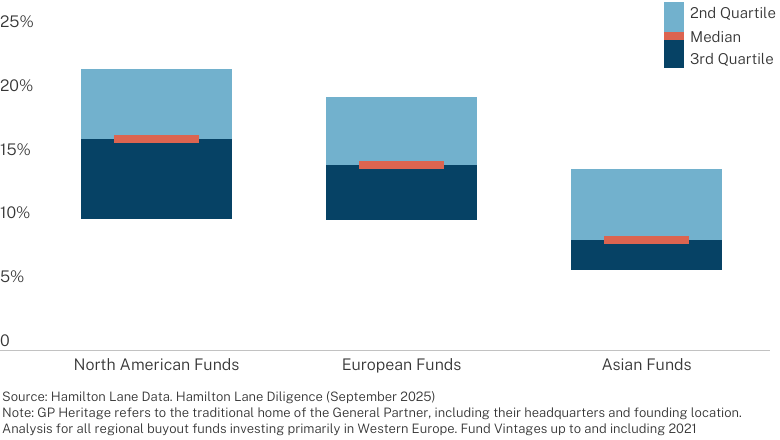
IRR Spreads by Region
Buyout Funds with Vintages 2010-2020
IRR Spreads by Region
Buyout Deals with Vintages 2010-2020
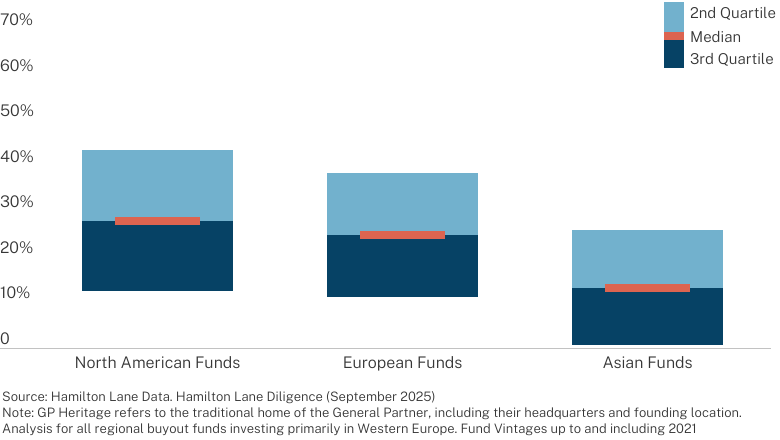
European buyout, in particular, has shown a lower risk profile compared to U.S. buyout. You are giving up some upside, but you are getting a more predictable outcome. In private equity, this can be an appealing option. Asian buyouts have even smaller spreads but have not shown the kinds of returns that will have investors shifting portfolios significantly.
Where do we come out on this U.S. dominance of the private markets? There are plenty of reasons why European and Asian opportunities will be attractive.
What's driving the opportunity set across Asia & Europe?
Non-U.S. Geographies have unique opportunities, that can help balance and diversify portfolios
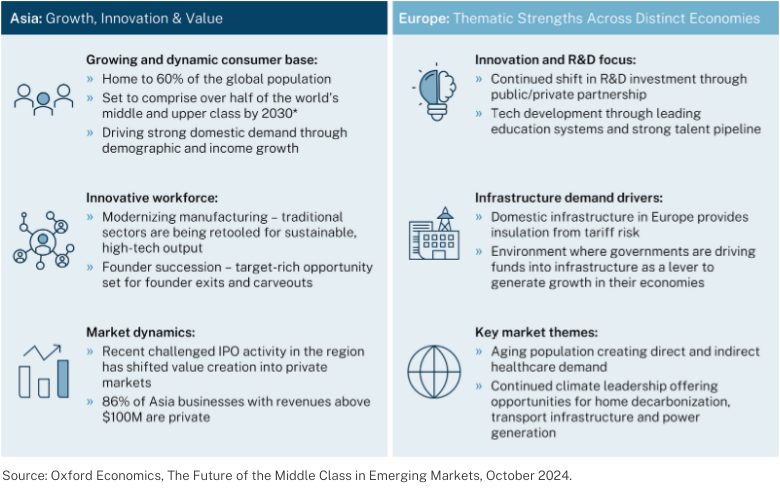
We have little doubt that non-U.S. private markets investing activity will increase over the next cycle. We also believe that a portfolio needs diversification across geographies. But we still believe that the more attractive opportunity set will be in the U.S. and that your best performing private markets portfolios will continue to be dominated by U.S. investments.
What does it all mean?
Here’s our favorite, all-in-one, color-coordinated chart.
The Hamilton Lane Worry Index
The Hamilton Lane Worry Index is a composite of Hamilton Lane's sentiment indicators.
Higher Numbers = More Worry
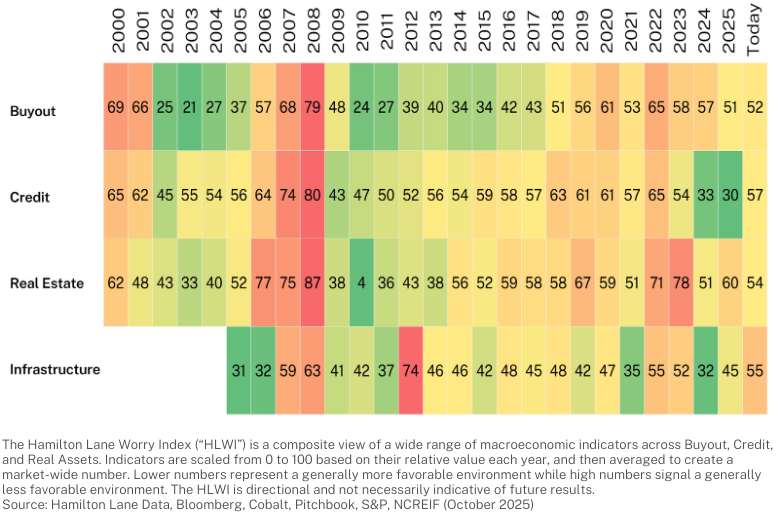
Flat line. Everything is neutral.
Hamilton Lane, you say, are you kidding? We come to the end of this mid-year tome, and you tell us everything is flat and dull?

And you should thank us for it. We know you are reading all sorts of stuff on the public markets. What are they telling you? Valuations are stretched. Market sentiment is bullish. Everything is screaming red. That doesn’t mean it will go down, but how would you feel if our sentiment indicators had us here telling you, “Yikes, all our boxes are flaming red!” You’d be worried.
Boring is good here. You are looking at private markets that are dull and investable. No extreme behavior, no particularly worrying indicators.
The thrill is gone... for now. Boring is your friend.
Infrastructure – An investment strategy that invests in physical systems involved in the distribution of people, goods, and resources.
Real Assets – Real Assets includes any PM fund with a strategy of Infrastructure, Natural Resources, or Real Estate.
Real Estate – Any closed-end fund that primarily invests in non-core real estate, excluding separate accounts and joint ventures.
DJ Brookfield Global Infrastructure Index – The DJ Brookfield Global Infrastructure Index is designed to measure the performance of companies globally that are operators of pure-play infrastructure assets.
DM Buyout – Includes any buyout fund that is primarily investing in developed markets of North America, Western Europe and Global.
BofAML High Yield Index – The BofAML High Yield index tracks the performance of below investment grade U.S. dollar-denominated corporate bonds publicly issued in the
U.S. domestic market.
Natural Resources – An investment strategy that invests in companies involved in the extraction, refinement, or distribution of natural resources.
S&P UBS Leveraged Loan Index: The S&P UBS Leveraged Loan Index represents tradable, senior-secured, U.S. dollar-denominated non-investment grade loans.
Barclays U.S. Corporate Aggregate Index: Tracks the performance of U.S. fixed rate corporate debt rated as investment grade.
FTSE/NAREIR All Equity REIT Index: The FTSE/NAREIT All Equity REIT Index tracks the performance of U.S. equity REITs.
MSCI World Energy Sector Index: The MSCI World Energy Sector Index measures the performance of securities classified in the GICS Energy sector.
All Private Markets: Hamilton Lane’s definition of “All Private Markets” includes all private commingled funds excluding fund-of-funds, and secondary fund-of-funds.
Secondary FoF: A fund that purchases existing stakes in private equity funds on the secondary market.
MSCI Europe Index: The MSCI Europe Index measures performance of large and mid-cap companies across 15 developed markets in Europe.
ROW: Any fund with a geographic focus outside of North America and Western Europe.
Fund-of-Funds (FoF) – A fund that manages a portfolio of investments in other private equity funds.
Sharpe Ratio – The Sharpe Ratio is the average return earned in excess of the risk-free rate per unity of volatility or total risk.
Desmoothing: A mathematical process to remove serial autocorrelation in the return stream of assets that experience infrequent appraisal pricing, such as private equity. Desmoothed returns may more accurately capture volatility than reported returns. The formula used here for desmoothing is:Where rD(t) = the desmoothed return for period t, r(t) = the return for period t, p = the autocorrelationrD(t) = (r(t) – r(t-1) * p) / (1 – p)
PME (Public Market Equivalent): Calculated by taking the fund cash flows and investing them in a relevant index. The fund cash flows are pooled such that capital calls are simulated as index share purchases and distributions as index share sales. Contributions are scaled by a factor such that the ending portfolio balance is equal to the private equity net asset value (equal ending exposures for both portfolios). This seeks to prevent shorting of the public market equivalent portfolio. Distributions are not scaled by this factor. The IRR is calculated based off of these adjusted cash flows.
This presentation has been prepared solely for informational purposes and contains confidential and proprietary information, the disclosure of which could be harmful to Hamilton Lane. Accordingly, the recipients of this presentation are requested to maintain the confidentiality of the information contained herein. This presentation may not be copied or distributed, in whole or in part, without the prior written consent of Hamilton Lane.
The information contained in this presentation may include forward-looking statements regarding returns, performance, opinions, the fund presented or its portfolio companies, or other events contained herein. Forward-looking statements include a number of risks, uncertainties and other factors beyond our control, or the control of the fund or the portfolio companies, which may result in material differences in actual results, performance or other expectations. The opinions, estimates, and analyses reflect our current judgment, which may change in the future.
All opinions, estimates and forecasts of future performance or other events contained herein are based on information available to Hamilton Lane as of the date of this presentation and are subject to change. Past performance of the investments described herein is not indicative of future results. In addition, nothing contained herein shall be deemed to be a prediction of future performance. The information included in this presentation has not been reviewed or audited by independent public accountants. Certain information included herein has been obtained from sources that Hamilton Lane believes to be reliable, but the accuracy of such information cannot be guaranteed.
This presentation is not an offer to sell, or a solicitation of any offer to buy, any security or to enter into any agreement with Hamilton Lane or any of its affiliates. Any such offering will be made only at your request. We do not intend that any public offering will be made by us at any time with respect to any potential transaction discussed in this presentation. Any offering or potential transaction will be made pursuant to separate documentation negotiated between us, which will supersede entirely the information contained herein.
Certain of the performance results included herein do not reflect the deduction of any applicable advisory or management fees, since it is not possible to allocate such fees accurately in a vintage year presentation or in a composite measured at different points in time. A client’s rate of return will be reduced by any applicable advisory or management fees, carried interest and any expenses incurred. Hamilton Lane’s fees are described in Part 2 of our Form ADV, a copy of which is available upon request.
The following hypothetical example illustrates the effect of fees on earned returns for both separate accounts and fund-of-funds investment vehicles. The example is solely for illustration purposes and is not intended as a guarantee or prediction of the actual returns that would be earned by similar investment vehicles having comparable features. The example is as follows: The hypothetical separate account or fund-of-funds consisted of $100 million in commitments with a fee structure of 1.0% on committed capital during the first four years of the term of the investment and then declining by 10% per year thereafter for the 12-year life of the account. The commitments were made during the first three years in relatively equal increments and the assumption of returns was based on cash flow assumptions derived from a historical database of actual private equity cash flows. Hamilton Lane modeled the impact of fees on four different return streams over a 12-year time period. In these examples, the effect of the fees reduced returns by approximately 2%. This does not include performance fees, since the performance of the account would determine the effect such fees would have on returns. Expenses also vary based on the particular investment vehicle and, therefore, were not included in this hypothetical example. Both performance fees and expenses would further decrease the return.
Hamilton Lane (Germany) GmbH is a wholly-owned subsidiary of Hamilton Lane Advisors, L.L.C. Hamilton Lane (Germany) GmbH is authorised and regulated by the Federal Financial Supervisory Authority (BaFin). In the European Economic Area this communication is directed solely at persons who would be classified as professional investors within the meaning of Directive 2011/61/EU (AIFMD). Its contents are not directed at, may not be suitable for and should not be relied upon by retail clients.
As of 11/18/2025