What’s Driving the Secondary Market?

What has been happening in the secondary market over the last couple of years?
Let’s set the stage with one of the biggest themes in the secondary market: Growth. Growth and the opportunity set, volume growth in the turnover rate, and growth in the way LPs and GPs are using the secondary market.
Market Opportunity Set
Driving Secondary Market Volume
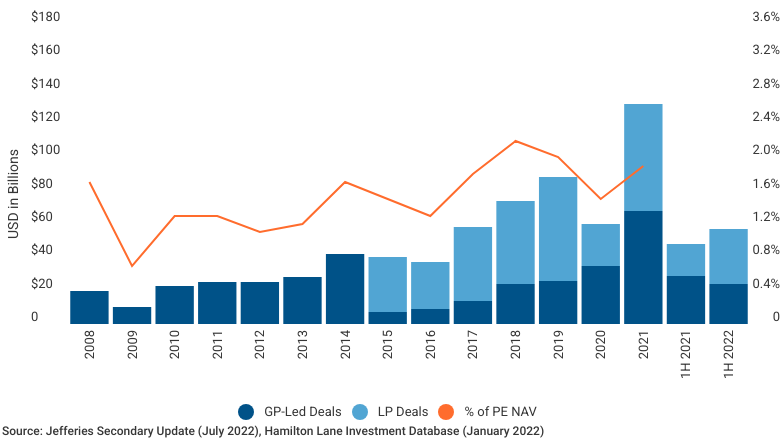
On this slide we show secondary market volume over the past 15 years. You can see the growth. It certainly hasn’t been in a straight line upwards each year, but over the past 15 years it has grown at a 15 to 20% compound annual rate. Last year was a record year for volume, and despite weaker macro conditions and lower secondary pricing this year, the volume in the first half was still higher than last year’s record.
Notice that beginning in 2015, we show volume separated between LP deals and GP-led deals. The secondary market is now generally characterized by these two types of deals. LP deals are the traditional secondary deal, where a buyer becomes a replacement LP. On the other hand, a GP-led secondary is a transaction initiated by a GP that impacts all LPs in the fund. The most common form is a continuation fund in which secondary buyers purchase one or more assets from an existing fund. As for why you should care, it is because the market has exploded.
GP-led secondaries in 2021 were larger than the entire secondary market just four years ago. So, what’s driving the growth of the overall market? We’ll explore three themes.
What Is Driving Secondary Volume?
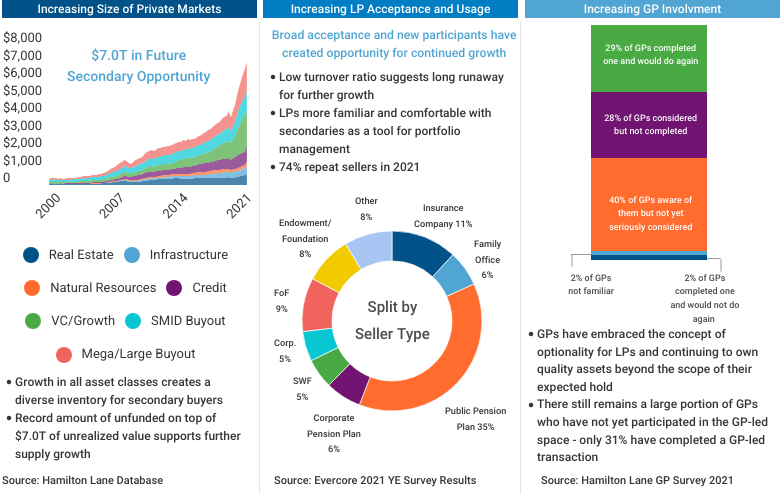
The first theme, the first big driver of growth is what you see on the left, which is the overall private markets growing. Net asset value in the entire private markets is $6.5 trillion today. Secondary buyers get really excited by this chart because this is our inventory to buy. Every one of these dollars is a chance for a secondary. This inventory is growing and it really provides fuel for the secondary market.
LPs Utilizing the Secondary Market
The second reason for massive growth is the increasing LP acceptance to execute secondaries. More and more LPs are using the secondary market to their benefit by managing their portfolios and exposures. It is now a very common tool for many LPs, and LPs have really embraced using the secondary market.
GP Involvement
The third driver of growth is increasing GP involvement. GPs have really embraced the concept of providing liquidity to LPs. Hamilton Lane conducted a survey asking GPs their opinion of these types of transactions. Look at the results in the chart above. Nearly every single GP who has completed a GP-led secondary said they would do it again. The other takeaway from the survey is that 96% of GPs indicated they are aware of them, are considering one or have done one and would do it again.
We think this will provide a backdrop for a continued wave of secondary deals. These are the three main drivers of secondary growth and we think these dynamics will persist for some time, creating more market growth in the future.
The projections published herein are based on a regression of quarterly public market index returns against quarterly private market index returns. This regression generates an alpha and a beta by strategy which can be used as inputs into the single-index model of pricing assets (Sharpe 1964, Lintner 1965). The formula for the single-index model is:
rPrivate Markets = αPrivate Markets + βPrivate Markets (rPublic Markets –rRisk Free )+ rRisk Free
Where:
rPrivate Markets = Return of Private Markets
rPublic Markets = Return of Public Markets
αPrivate Markets = Alpha of Private Markets
βPrivate Markets = Beta of Private Markets
rRisk Free = Risk Free Rate
The regression formulas for Core and Non-Core Real Estate differ slightly from the single-index model in that the regressions are multi-index models, which include multiple betas and public market returns to better predict private market returns, such as the U.S. Regression Indicator Index.
Once all inputs are obtained, we create a 75% confidence interval for our expected returns. This should denote the inherent uncertainty in these sorts of predictions. In general, we expect to be accurate within a 400 basis point spread with 75% confidence in quarters of normal stock market volatility. During periods of outsized positive or negative returns in the public markets, we would expect to either be less accurate or for the confidence interval to expand meaningfully. We also expect individual portfolios to vary meaningfully from these projections, as individual portfolio returns vary from the industry’s returns for many reasons, including concentration of assets, different investment pacing, and different strategy/geography makeups, to name a few. Larger and more mature portfolios should be expected to have a performance more similar to the market, and therefore more reflective of these estimates, than other portfolios might be.
To estimate the next quarter’s valuation for a portfolio, you can apply the estimated quarterly growth rate associated with it. The quarterly growth rate should be applied after adjusting for all fund contributions and distributions made during the quarter, in accordance with the Simple-Dietz methodology for calculating returns. Note that all calculations shown in the document are in USD. Therefore, the formula for calculating rPrivate Markets shown above yields a return in USD. To apply the rPrivate Markets to a portfolio with valuation and cash flow information already in USD, use the formula below:
Predicted NAVEnding=(NAVBeginning)(1+rPrivate Markets)+ ((1+rPrivate Markets)/2)(Period Capital Calls–Period Distributions)
If the portfolio valuation and cash flow information is not in USD OR you wish to convert a USD return to a non-USD currency, an “FX Effect” factor must be applied. The formula should be adjusted as shown below:
Predicted NAVEnding=(NAVBeginning)(1+rPrivate Markets+FX Effect)+ (1+(rPrivate Markets+FX Effect)/2)(Period Capital Calls–Period Distributions)
Strategy Definitions:
Credit: This strategy focuses on providing debt capital.
EU Buyout: Any buyout fund primarily investing in the European Union.
Mega/Large Buyout: Any buyout fund larger than a certain fund size that depends on the vintage year.
Real Estate: Any closed-end fund that primarily invests in non-core real estate, excluding separate accounts and joint ventures.
SMID Buyout: Any buyout fund smaller than a certain fund size, dependent on vintage year.
VC/Growth: Includes all funds with a strategy of venture capital or growth equity.
Index Definitions:
MSCI Europe Index: The MSCI Europe Index tracks large and mid-cap equity performance across 15 developed market countries in Europe.
MSCI World Index: The MSCI World Index tracks large and mid-cap equity performance in developed market countries.
S&P 500 Index: The S&P 500 Index tracks 500 largest companies based on market capitalization of companies listed on NYSE or NASDAQ.
This document has been prepared solely for informational purposes and contains confidential and proprietary information, the disclosure of which could be harmful to Hamilton Lane. Accordingly, the recipients of this document are requested to maintain the confidentiality of the information contained herein. This document may not be copied or distributed, in whole or in part, without the prior written consent of Hamilton Lane.
There are a number of factors that can affect the private markets which can have a substantial impact on the results included in this analysis. There is no guarantee that this analysis will accurately reflect actual results which may differ materially. These valuations do not necessarily reflect current values in light of market disruptions and volatility experienced in the fourth quarter of 2020, particularly in relation to the evolving impact of COVID-19, which is affecting markets globally.
The information contained in this presentation may include forward-looking statements. Forward-looking statements include a number of risks, uncertainties and other factors beyond our control which may result in material differences in actual results, performance or other expectations. The opinions, estimates and analyses reflect our current judgment, which may change in the future.
All opinions, estimates and forecasts contained herein are based on information available to Hamilton Lane as of the date of this presentation and are subject to change. The information included in this presentation has not been reviewed or audited by independent public accountants. Certain information included herein has been obtained from sources that Hamilton Lane believes to be reliable but the accuracy of such information cannot be guaranteed.
This presentation is not an offer to sell, or a solicitation of any offer to buy, any security or to enter into any agreement with Hamilton Lane or any of its affiliates. Any such offering will be made only at your request. We do not intend that any public offering will be made by us at any time with respect to any potential transaction discussed in this presentation. Any offering or potential transaction will be made pursuant to separate documentation negotiated between us, which will supersede entirely the information contained herein.
The information herein is not intended to provide, and should not be relied upon for, accounting, legal or tax advice, or investment recommendations. You should consult your accounting, legal, tax or other advisors about the matters discussed herein.
Hamilton Lane (UK) Limited is a wholly-owned subsidiary of Hamilton Lane Advisors, L.L.C. Hamilton Lane (UK) Limited is authorized and regulated by the Financial Conducts Authority. In the UK this communication is directed solely at persons who would be classified as a professional client or eligible counterparty under the FCA Handbook of Rules and Guidance. Its contents are not directed at, may not be suitable for and should not be relied upon by retail clients.
Hamilton Lane Advisors, L.L.C. is exempt from the requirement to hold an Australian financial services license under the Corporations Act 2001 in respect of the financial services by operation of ASIC Class Order 03/1100: U.S. SEC regulated financial service providers. Hamilton Lane Advisors, L.L.C. is regulated by the SEC under U.S. laws, which differ from Australian laws. The PDS and target market determination for the Hamilton Lane Global Private assets Fund (AUD) can be obtained by calling 02 9293 7950 or visiting our website www.hamiltonlane.com.au.
Hamilton Lane (Germany) GmbH is a wholly-owned subsidiary of Hamilton Lane Advisors, L.L.C. Hamilton Lane (Germany) GmbH is authorised and regulated by the Federal Financial Supervisory Authority (BaFin). In the European Economic Area this communication is directed solely at persons who would be classified as professional investors within the meaning of Directive 2011/61/EU (AIFMD). Its contents are not directed at, may not be suitable for and should not be relied upon by retail clients.
As of October 5, 2022