What's It Worth?

What’s it worth?
Perhaps the most frequently asked question in today’s private market realm: How much is it worth? Quarterly valuations of illiquid portfolios have always created questions and at least some level of uncertainty, if not outright skepticism, for investors. Rather than get caught up in conjecture, let’s turn instead to our trusty data toolkit to shed some light on the topic. Ever the unique asset, having actual private market data, cash flows and performance values becomes especially useful in times of volatility and market uncertainty.
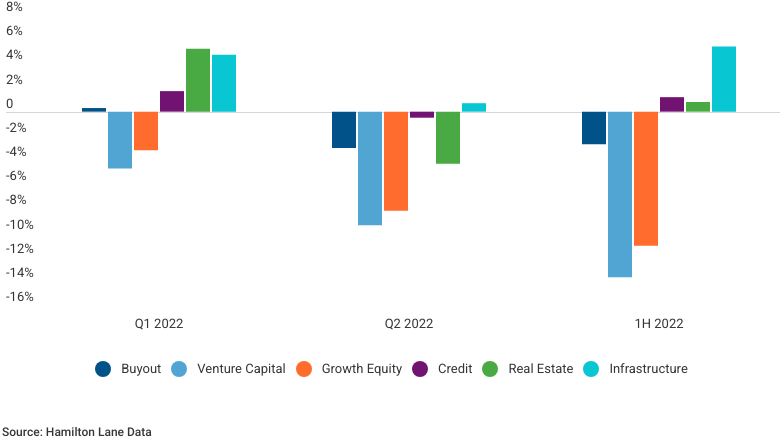
As demonstrated in our quarterly predictive valuation modeling, our proprietary database and analytics tools give us insight into how values across private market strategies and assets might change. See the chart below for our Q2 predictive model published just after quarter end in July 2022 and ahead of the official General Partner portfolio marks. Despite public equity market indices being down ~20%, our intel suggested the private markets would be modestly flat to down. And as the official Q2 marks have rolled in through August and September, that is where they largely ended up on an actual observed basis. Similarly, we mentioned the current environment being more of a thematic, ‘deal pickers’ market, with greater dispersion of outcomes depending on portfolio strategy choices. In the near term, return dispersion may tighten as the majority of managers take modest markdowns, but we expect that dynamic will play out longer-term as deals from this era are exited.
2022 Q2 Estimated returns by strategy
.webp?language=en-US)
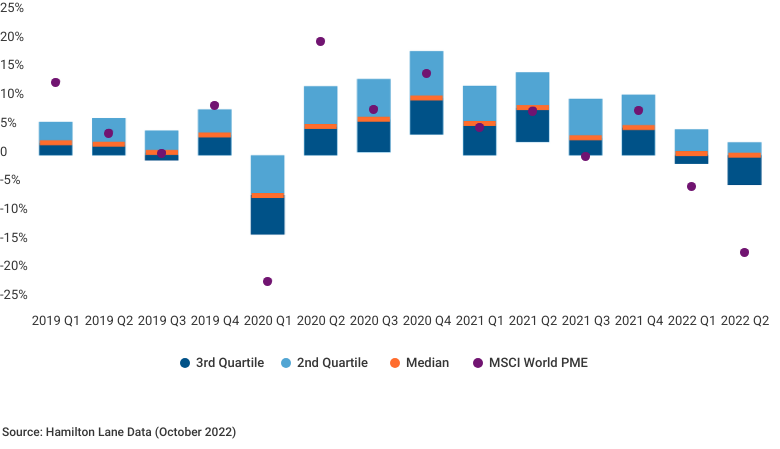
CY 2022 Private Markets Returns by Strategy
An Uncomfortable Starting Point
Back to the question at hand. Let’s start with the common ‘myth’ regarding private market valuations: They are some combination of a farce, nonsensical, and just made up. The reality, of course, is that they are no such thing. But why then, if public markets are down 20%+, aren’t private market holdings showing similar movements? The answer has a few key components:
- Purchase price multiple cushions for private transactions at entry relative to comparable public companies at the time;
- The fundamental earnings outlook facilitated by long-term focused, actively-managed governance structures common in private market transactions, where a single buyer typically controls the company; and
- The impact of a ‘lag in quarterly reporting’ for the private market ecosystem.
Investors shouldn’t underestimate the positive benefit of the first two components, which we have discussed in previous papers. But that last piece is where critics typically focus (often with limited acknowledgement of the first two points). Namely, the argument goes that it is only a matter of time before these private markets managers will feel the pain the public world has already experienced. It is true, this reporting lag – typically 45-60 days after quarter end until official marks are required – often gives managers the benefit of seeing where public market values trend post-quarter end. So there is some benefit, for example with June 30 valuations, when July then saw a modest recovery of public market values and multiples. That post-quarter improvement likely factored into reported holding valuation multiples. At the same time, while the magnitude of shifts was more muted in the private market sphere, in terms of the numbers, roughly 50% of buyout General Partners took some level of portfolio markdowns in each of the first two quarters of 2022. The chart below illustrates this trend, showing the dispersion of returns by quarter for equity buyout funds that were three to 10 years old as of June 30. Also of note, there is indeed a close correlation with public market movements.
Dispersion of QoQ Buyout Valuation Changes
Q3 Valuation Movement Expectations
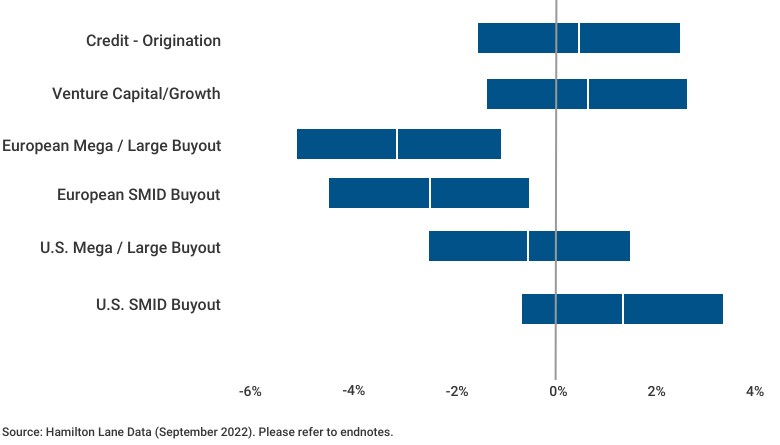
Now to the meat of the matter. With that as the backdrop, what might this mean for the expected quarter-over-quarter movement for September 30 valuations? There are a couple of ways to break this down, and we will start by using our standard alpha-beta regression analysis, isolating the quarter. This analysis implies a very similar trajectory to what we saw in Q2. While there is variation of outcomes by geography and sub-strategy, median equity buyout performance will likely be flattish. However, looking at the ranges below, our view is that these median values are likely a bit optimistic and would generally steer our expectations to the lower end of most of these ranges.
To further explain that position, and consider some slightly different ways to look at the current context of the Q3 movement relative to the trend, we turn back to our predictive valuation model.
2022 Q3 Estimated Returns by Strategy
The above chart evaluates the predictive move for the quarter essentially in a vacuum. However, the current trend, with consecutive negative quarters of public market movements, is a rarer phenomenon that cannot be ignored. Specifically, Q3 2022 was the first quarter with three consecutive negative public market movements since the GFC. Thus, it requires us to dig a little deeper into the data. Again, we will focus on the private equity buyout space, given it is a proxy to public equity markets and the strategy represents the lion’s share of private market NAV. As shown in the chart below, the dot-com bubble and GFC downturns generated negative valuation movement in the 3-5% range for the same corresponding quarter post-downturn.
Buyout vs. Global Equities Quarterly TWRS
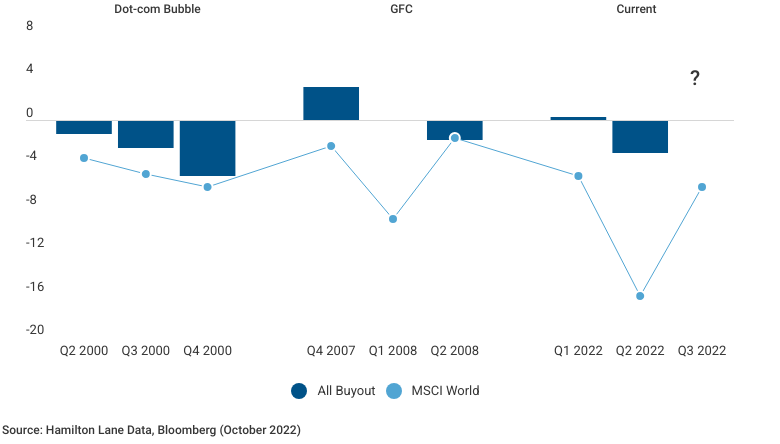
Triangulating from the analysis above, as well as assembling some early anecdotal feedback from GPs, Q3 may demonstrate a similar trajectory as Q2 for most equity managers – valuations that are down modestly (another 0-5% decline Q-o-Q). Of course, there will be differences by strategy, geography, etc. For example, credit and real asset strategies may show continued resiliency, with potentially more pain felt among European and UK managers reflective of currency movements and the macroeconomic picture.
Hands on the Wheel
Where do we go from here? As we’ve written about in prior market commentary, we continue to believe ‘staying the course’ generally makes sense. Today’s market context appears intent on making investors think they need to do something differently. “Change something; anything, in the face of new macro-economic pivots, headwinds and persistent geopolitical uncertainties,” it seems to say. We would posit that in fact, one should do anything but take that approach. Of course, investors need to take note of variables that may look or feel different than compared to the past 10+ years. And yes, some incremental changes or re-examinations are warranted. As we have continued to suggest, certain strategies that can mute volatility, enhance yield and shorten duration probably make more sense in this current end-of-cycle context. But it does not mean that investors should completely abandon ship, create change for change’s sake, or do a 180 degree turn away from tried and true strategies. This is particularly true as the risk-return and value-oriented paradigms create new opportunities.
Hopefully our private market data, cash flows and performance values have helped paint a picture for where we might stand. Of course, valuations are but one of the topics trending in the private markets today. With that in mind, what else should investors be considering? We’ll leave you with a few of the more interesting themes we are seeing evolve related to private markets.
Quick Hits – Other Select Emerging Themes:
- One size doesn’t fit all – We expect differentiated global economic recoveries and outcomes that will vary by region. This is true on the corporate side as well, where profitability and balance sheet health will be key points of delineation.
- Dry Powder is golden; at a premium – For General Partners, there has been a significant shift in the rate of both contribution (investments/deal making) and distribution activity (realizations). One impact is a more challenging fundraising environment, making capital that is undeployed a scarcer resource than it has been through the last cycle. This has also driven increased co-investment volumes – despite declining overall deal activity levels – and created differentiated opportunities for secondary transactions. Speaking of secondaries...
- Testing the waters in the secondary market – One of the most telling interim quarter indicators for valuation movement and pricing tends to be the rapidly evolving secondary market. The overall volume of potential opportunities seeking capital is up year-over-year; however, completed transactions are down meaningfully. Not to mention, the good-old fashioned traditional LP secondary is coming back as
the allocation and denominator effect is real. However, for now, the buyer-seller disconnect is still fairly wide except for the highest quality of portfolios. This is one of the more compelling areas to watch in our opinion. - Energy transition with infra in focus – Infrastructure appears to be one of the few places where investment pacing hasn’t slowed too much. There is probably good reason for that: Several governments have announced or already passed large infrastructure spending plans. The rising cost of traditional energy resources has also made alternative energy sources look comparatively more attractive and has inspired nations without robust fossil fuel reserves to explore alternative energy as an avenue to diversify their energy sources.
- I see you, Private Credit – It is amazing how quickly ‘relationship lending’ to the buyout world comes back into favor once the ‘lowest cost of debt’/booming public credit markets are less relevant. Similar to Q2 2020, it is a good time to have capital to lend, as interest spreads widen, and terms and loan documentation tighten to be more lender friendly. Oh, and by the way, an asset class that is 90%+ floating rate has seen the benefit of enhanced yields as SOFR approaches 4% today, compared to less than the 1% floor at the start of the year.
- Expectation of a busy year-end and start to the new year for investors? Will the ‘new normal’ of deal pricing crystalize as downward market and economic pressures persist through the end of the year, further narrowing the current buyer-seller disconnect? History has shown that the time frame in which to see a rebound in traditional equity deal making post a downturn is typically 6-12 months. This could make for a busy start to 2023 considering the pent-up demand. Undoubtedly, heightened volatility is likely to continue, which has been a huge advantage for private market strategies within a broader portfolio.
rPrivate Markets = αPrivate Markets + βPrivate Markets (rPublic Markets –rRisk Free )+ rRisk Free
Where:
rPrivate Markets = Return of Private Markets
rPublic Markets = Return of Public Markets
αPrivate Markets = Alpha of Private Markets
βPrivate Markets = Beta of Private Markets
rRisk Free = Risk Free Rate
The regression formulas for Core and Non-Core Real Estate differ slightly from the single-index model in that the regressions are multi-index models, which include multiple betas and public market returns to better predict private market returns, such as the U.S. Regression Indicator Index.
Once all inputs are obtained, we create a 75% confidence interval for our expected returns. This should denote the inherent uncertainty in these sorts of predictions. In general, we expect to be accurate within a 400 basis point spread with 75% confidence in quarters of normal stock market volatility. During periods of outsized positive or negative returns in the public markets, we would expect to either be less accurate or for the confidence interval to expand meaningfully. We also expect individual portfolios to vary meaningfully from these projections, as individual portfolio returns vary from the industry’s returns for many reasons, including concentration of assets, different investment pacing, and different strategy/geography makeups, to name
a few. Larger and more mature portfolios should be expected to have a performance more similar to the market, and therefore more reflective of these estimates, than other portfolios might be.
To estimate the next quarter’s valuation for a portfolio, you can apply the estimated quarterly growth rate associated with it. The quarterly growth rate should be applied after adjusting for all fund contributions and distributions made during the quarter, in accordance with the Simple-Dietz methodology for calculating returns. Note that all calculations shown in the document are in USD. Therefore, the formula for calculating rPrivate Markets shown above yields a return in USD. To apply the rPrivate Markets to a portfolio with valuation and cash flow information already in USD, use the formula below:
Predicted NAVEnding=(NAVBeginning)(1+rPrivate Markets)+ ((1+rPrivate Markets)/2)(Period Capital Calls–Period Distributions)
If the portfolio valuation and cash flow information is not in USD OR you wish to convert a USD return to a non-USD currency, an “FX Effect” factor must be applied. The formula should be adjusted as shown below:
Predicted NAVEnding=(NAVBeginning)(1+rPrivate Markets+FX Effect)+ (1+(rPrivate Markets+FX Effect)/2)(Period Capital Calls–Period Distributions)
Credit: This strategy focuses on providing debt capital.
EU Buyout: Any buyout fund primarily investing in the European Union.
Mega/Large Buyout: Any buyout fund larger than a certain fund size that depends on the vintage year.
Real Estate: Any closed-end fund that primarily invests in non-core real estate, excluding separate accounts and joint ventures.
SMID Buyout: Any buyout fund smaller than a certain fund size, dependent on vintage year.
VC/Growth: Includes all funds with a strategy of venture capital or growth equity.
Index Definitions:
MSCI Europe Index: The MSCI Europe Index tracks large and mid-cap equity performance across 15 developed market countries in Europe.
MSCI World Index: The MSCI World Index tracks large and mid-cap equity performance in developed market countries.
S&P 500 Index: The S&P 500 Index tracks 500 largest companies based on market capitalization of companies listed on NYSE or NASDAQ.
There are a number of factors that can affect the private markets which can have a substantial impact on the results included in this analysis. There is no guarantee that this analysis will accurately reflect actual results which may differ materially. These valuations do not necessarily reflect current values in light of market disruptions and volatility experienced in the fourth quarter of 2020, particularly in relation to the evolving impact of COVID-19, which is affecting markets globally.
The information contained in this presentation may include forward-looking statements. Forward-looking statements include a number of risks, uncertainties and other factors beyond our control which may result in material differences in actual results, performance or other expectations. The opinions, estimates and analyses reflect our current judgment, which may change in the future.
All opinions, estimates and forecasts contained herein are based on information available to Hamilton Lane as of the date of this presentation and are subject to change. The information included in this presentation has not been reviewed or audited by independent public accountants. Certain information included herein has been obtained from sources that Hamilton Lane believes to be reliable but the accuracy of such information cannot
be guaranteed.
This presentation is not an offer to sell, or a solicitation of any offer to buy, any security or to enter into any agreement with Hamilton Lane or any of its affiliates. Any such offering will be made only at your request. We do not intend that any public offering will be made by us at any time with respect to any potential transaction discussed in this presentation. Any offering or potential transaction will be made pursuant to separate documentation negotiated between us, which will supersede entirely the information contained herein.
The information herein is not intended to provide, and should not be relied upon for, accounting, legal or tax advice, or investment recommendations. You should consult your accounting, legal, tax or other advisors about the matters discussed herein.
Hamilton Lane (UK) Limited is a wholly-owned subsidiary of Hamilton Lane Advisors, L.L.C. Hamilton Lane (UK) Limited is authorized and regulated by the Financial Conducts Authority. In the UK this communication is directed solely at persons who would be classified as a professional client or eligible counterparty under the FCA Handbook of Rules and Guidance. Its contents are not directed at, may not be suitable for and should not be relied upon by retail clients.
Hamilton Lane Advisors, L.L.C. is exempt from the requirement to hold an Australian financial services license under the Corporations Act 2001 in respect of the financial services by operation of ASIC Class Order 03/1100: U.S. SEC regulated financial service providers. Hamilton Lane Advisors, L.L.C. is regulated by the SEC under U.S. laws, which differ from Australian laws. The PDS and target market determination for the Hamilton Lane Global Private assets Fund (AUD) can be obtained by calling 02 9293 7950 or visiting our website www.hamiltonlane.com.au.
Hamilton Lane (Germany) GmbH is a wholly-owned subsidiary of Hamilton Lane Advisors, L.L.C. Hamilton Lane (Germany) GmbH is authorised and regulated by the Federal Financial Supervisory Authority (BaFin). In the European Economic Area this communication is directed solely at persons who would be classified as professional investors within the meaning of Directive 2011/61/EU (AIFMD). Its contents are not directed at, may not be suitable for and should not be relied upon by retail clients.
As of October 21, 2022