U.S. Industrial Outdoor Storage: The Next Big Real Estate Subsector?

Within the private markets, real estate is a popular sub-asset class for investors and continues to grow in terms of investor interest and overall capital allocated. However, real estate is a broad, fragmented and dynamic section of the private markets, with some segments less well-known to LPs, but which can present good opportunity in the current market. At Hamilton Lane, we believe that Industrial Outdoor Storage (“IOS”) – an industrial real estate subsector that is a critical component of the supply chain for retailers and logistics operators – is one such area. What do we mean by “Industrial Outdoor Storage”?
IOS properties include low-coverage last-mile distribution facilities, truck terminals and storage yards. These assets facilitate direct distribution of goods, truck/van transfers and staging or storage for equipment, materials and inventory. IOS facilities are largely single-tenanted properties, leased on a triple-net basis and are located near metropolitan areas, major transportation nodes, ports (nautical and air), railyards and intermodals.
The Appeal
The IOS investment thesis is supported by structural supply and demand factors. The sector benefits from growing demand due to the critical supply chain nature of these assets for e-commerce and global trade as well as technological changes in the transportation sector. At the same time, IOS site supply is decreasing as existing land is being taken up by warehouse developers, and very little new supply is coming online as communities are reluctant to grant entitlements given traffic, noise and aesthetic concerns.
This supply and demand imbalance in the U.S. IOS space has led rents to advance by nearly 30% on average since the end of 2019 and vacancy to fall to less than 3% in mid-2022.1 In addition, given the fragmented nature of current IOS ownership and the nascency of the sector from an institutional perspective, IOS assets can be acquired at capitalization rates (i.e., initial yields) that are typically 100bps to 250bps higher than traditional industrial assets. With the potential for strong income growth over the near-term and higher entry cap rates, IOS provides an attractive risk-adjusted investment opportunity.
IOS Overview
IOS is a subsector within the broader industrial real estate property type. A distinguishing feature of IOS assets is large outdoor space that is often used for truck and vehicle parking, fleet maintenance, equipment, container and bulk goods storage, drop lots or heavy industrial activity.
The main physical characteristics of these sites include a large, clear and open space with security fencing and lighting, as well as a physical structure used for office purposes. The actual building components to IOS sites are generally small relative to the overall lot size, often with Floor Area Ratios (“FAR”) of less than 20%. Some IOS sites may not have any building improvements, while others may have some equipment servicing facilities, high-flow-through (“HFT”) warehouses or a small administrative office space. Given the limited amount of building space, IOS assets require minimal ongoing capital expenditures and obsolescence is not a major consideration.
IOS Facilities
| Use | Transportation, logistics providers, bulk drop off, maintenance, and container, vehicle, chassis, and equipment storage |
| Location Criteria | Proximate to large population centers, ports (sea and air), and transportation / intermodal infrastructure |
| Total Area | Typically 2 to 10 acres |
| Building Characteristics | Typically, 10,000 sf to 100,000 sf; 16-foot clear height; grade-level doors; office or maintenance facility, wash bays |
| Important Attributes | Low FAR <20%, large parking / drop area and perimeter security |
Since IOS assets provide a critical connection point in the flow of goods and services, the key drivers of value for IOS sites are location and accessibility. These facilities are primarily located adjacent to ports, airports, railyards, intermodals and major highways. IOS assets serve e-commerce tenants and local distribution, construction, services and transportation businesses. These critically located sites provide e-commerce players with a link to truck terminals, parking facilities and small drop-off facilities, while linking transportation services around distribution hubs. IOS assets also provide laydown yards and storage space for bulk goods, equipment and raw materials, which are utilized by a diverse base of contractors, manufacturers, commodities suppliers, and oil and gas users. In other words, IOS is an essential component of our industrial economy.
Uses of IOS Facilities
- Truck terminals, maintenance and heavy equipment facilities
- Drop lots and contractor yards
- Fleet facilities
- Container yards
- Bulk material yards
- HFT facilities
Leases and Tenants
IOS facilities are largely single-tenanted, often leased on a triple-net basis, and have rents that are generally quoted in terms of rent per acre per month since the value of these sites goes beyond the leasable space in a building. New leases typically span between five to seven years with contractual rent escalators of 3% to 4% per annum. Institutional landlords aim to get parent company guarantees on leases and tenants do not have any termination rights. Expenses are predictable as landlords are mostly responsible for roof, structure and yard maintenance, and leasing costs are fairly low given stickiness of tenants.
Tenant credit profiles can range from small, local and regional businesses to investment-grade companies that operate IOS locations nationwide. Some of the largest retailers and logistics users include Amazon, FedEx, UPS, Walmart, Target, Home Depot, SWIFT and XPO. Some of the largest rental and construction tenants include ABC Supply Co., Beacon Roofing, Herc Rentals, Ryder, Builders FirstSource, Sunbelt Rental and United Rentals.
Demand Drivers
The industrial real estate sector is supported by structural demand drivers stemming from e-commerce penetration and onshoring trends. While growth in e-commerce was present before 2020, the COVID-19 pandemic accelerated the demand for online shopping and the need for logistics facilities to meet this demand. In 2019, online sales in the U.S. accounted for 10.9% of total retail sales; however, this figure has grown to 14.9% as of Q4 2022.2 This growth in turn is fueling demand for industrial real estate. To illustrate this point, an online sale through an e-commerce channel requires three times the logistical space of a traditional sale from a brick-and-mortar channel. In addition, recent supply chain and geopolitical issues have prompted companies to hold more inventory to protect against disruptions, which has accelerated near-shoring trends.
These tailwinds are driving demand for both traditional industrial warehouse buildings and IOS facilities. Retailers and logistics providers need space to transfer goods to trucks/vans, park unused vehicles, stow containers, and store equipment and materials that do not require indoor facilities. Importers and manufacturers need space to transfer finished products and store goods and materials. This path of goods movement is particularly driving demand for IOS facilities focused on distribution infrastructure and high-flow-through facilities.
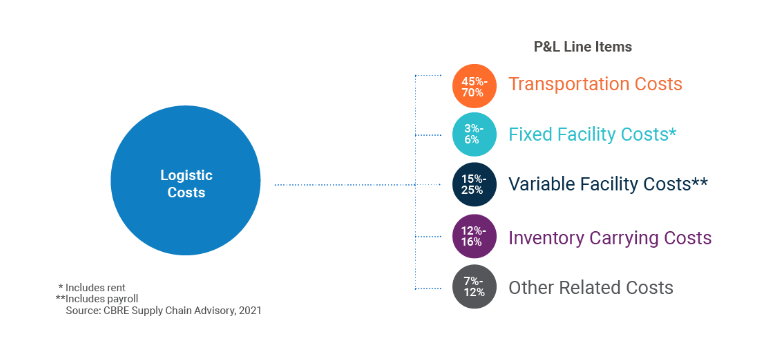
On average, a company’s total logistics costs comprise 45% to 70% for transportation, 15% to 25% for variable facility costs including payroll, 12% to 16% for inventory carrying costs, 3% to 6% for fixed facility costs such as rent and 7% to 12% for other related costs.3 In order to reduce overall costs, companies are seeking to locate their distribution infrastructure in first mile locations (near transportation nodes and ports of entry) or final mile locations (urban, infill locations). For example, an 8% increase in fixed facility costs is estimated to equal the impact of just a 1% increase in transportation costs, illustrating that increasing inventories by adding more warehouse and distribution space can significantly reduce transportation costs for many shippers. This is driving demand for transportation advantaged IOS properties that provide value by reducing shipping costs and/or increasing delivery speeds.
Anatomy of a Company's Logistics Spend
Supply Constraints
While demand for IOS is increasing, supply is decreasing. Many IOS sites have been rezoned or redeveloped, primarily as traditional warehouse facilities. While the existing IOS stock is taken out of the market for higher and better uses, new IOS developments are limited and are not keeping pace with growing demand. Restrictive local zoning often constricts new supply from coming online. Given the high levels of truck traffic and noise that distribution infrastructure generates, local governments and communities are making it difficult to obtain new entitlements for logistics assets. This is particularly acute for low-coverage IOS sites that generate the most traffic and the least municipal revenue of all industrial uses.
Transaction Dynamics & Opportunity Set
The IOS market is sizable, with over $200 billion of aggregate market value;4 however, given average deal sizes of $5 million to $15 million per IOS asset, larger investors with minimum investment thresholds have overlooked the sector. A vast majority of IOS assets are privately held, with fragmented ownership across owner-occupiers, developers and individual investors. These smaller investors are typically less sophisticated, leading to market inefficiencies, opportunities for off-market acquisitions and better pricing. Many of these landlords charge below-market rates that are not reflective of value within the yard component of these assets.
As the supply and demand imbalance in the sector attracts interest from private and institutional investors, IOS transaction activity increased from $1.8 billion per year between 2015 to 2018 to over $2.6 billion in 2019.5 As deal activity has continued to accelerate post-COVID, investors recognize an opportunity to add value through leasing expertise, acquiring assets to achieve scale and selling as a portfolio to larger investors and REITs.
Returns
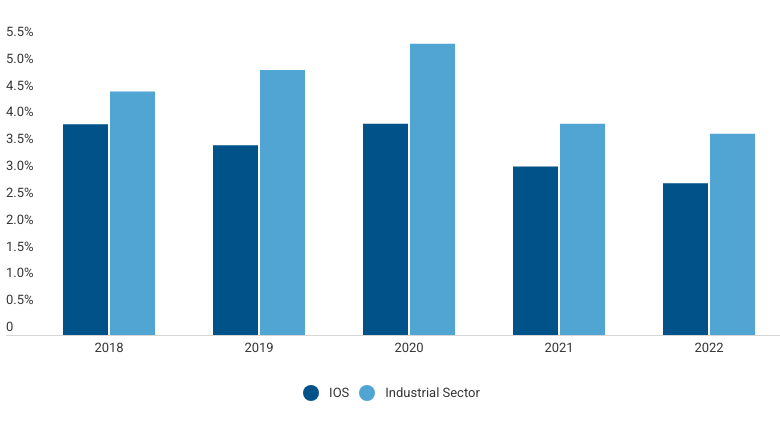
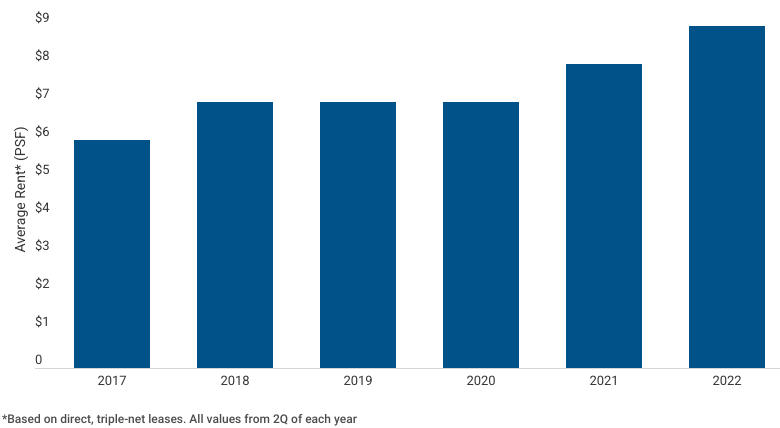
As a result of the aforementioned supply and demand imbalance, vacancy across the IOS sector has remained well below the average vacancy level for the overall U.S. industrial sector over the past decade. As of mid-2022, average IOS vacancy reached below 3%. The lack of available space is also driving IOS rent growth, resulting in IOS rents increasing by nearly 30% on average since the end of 2019.1
In addition, the entry cap rates for IOS assets are higher than yields on traditional industrial assets. Due to several factors including lack of competition from large investors and an ability to purchase assets in off-market transactions from unsophisticated sellers, IOS assets typically trade at a 100bps to 250bps yield spread over traditional industrial assets.
High entry yields and strong rental growth mean that a large component of IOS investment returns is derived from income instead of appreciation. With stable income returns and less volatility in total returns, IOS offers yield-oriented investors an attractive opportunity to deploy capital.
Exit Considerations
While reduced levels of competition when acquiring IOS assets allows for higher entry yields, the relative lack of liquidity at exit may restrict potential for appreciation. There are several factors to mitigate this risk. With high cash yields and low capex requirements, IOS assets offer investors optionality on the hold period and exit, which is important to offset potential liquidity risks. In addition, investors can aggregate a portfolio of IOS assets, which otherwise would have been too small for institutional investors, and look to monetize at a premium through a portfolio sale. We believe that portfolios of significant size could potentially garner material cap rate premiums.
Given its appeal, demand drivers and attractive opportunity to deploy capital, will IOS be the next hot real estate subsector to which institutional capital will flock? Time will tell…
IOS vs. Industrial Vacancy6
IOS Rent Trends6
1Source: CoStar, “More Investors Park Dollars in Industrial Outdoor Storage”, as of April 2023
2Source: U.S. Census Bureau, E-Commerce Retail Sales as a Percent of Total Sales [ECOMPCTSA], retrieved from FRED, Federal Reserve Bank of St. Louis, as of February 2023
3Source: CBRE “Supply Chain Disruptions Create New Opportunities for Industrial & Logistics Real Estate”, as of December 2021
4Source: Bisnow “‘You’ve Driven Past Them A Million Times’: The $200B Opportunity of Industrial Outdoor Storage”, as of February 2023
5Source: Brasa Capital Management, as of March 2023
6Source: Marcus & Millichap, as of October 2023
This presentation has been prepared solely for informational purposes and contains confidential and proprietary information, the disclosure of which could be harmful to Hamilton Lane. Accordingly, the recipients of this presentation are requested to maintain the confidentiality of the information contained herein. This presentation may not be copied or distributed, in whole or in part, without the prior written consent of Hamilton Lane.
The information contained in this presentation may include forward-looking statements regarding returns, performance, opinions, the fund presented or its portfolio companies, or other events contained herein. Forward-looking statements include a number of risks, uncertainties and other factors beyond our control, or the control of the fund or the portfolio companies, which may result in material differences in actual results, performance or other expectations. The opinions, estimates and analyses reflect our current judgment, which may change in the future.
All opinions, estimates and forecasts of future performance or other events contained herein are based on information available to Hamilton Lane as of the date of this presentation and are subject to change. Past performance of the investments described herein is not indicative of future results. In addition, nothing contained herein shall be deemed to be a prediction of future performance. The information included in this presentation has not been reviewed or audited by independent public accountants. Certain information included herein has been obtained from sources that Hamilton Lane believes to be reliable, but the accuracy of such information cannot be guaranteed.
This presentation is not an offer to sell, or a solicitation of any offer to buy, any security or to enter into any agreement with Hamilton Lane or any of its affiliates. Any such offering will be made only at your request. We do not intend that any public offering will be made by us at any time with respect to any potential transaction discussed in this presentation. Any offering or potential transaction will be made pursuant to separate documentation negotiated between us, which will supersede entirely the information contained herein.
Certain of the performance results included herein do not reflect the deduction of any applicable advisory or management fees, since it is not possible to allocate such fees accurately in a vintage year presentation or in a composite measured at different points in time. A client’s rate of return will be reduced by any applicable advisory or management fees, carried interest and any expenses incurred. Hamilton Lane’s fees are described in Part 2 of our Form ADV, a copy of which is available upon request.
The following hypothetical example illustrates the effect of fees on earned returns for both separate accounts and fund-of-funds investment vehicles. The example is solely for illustration purposes and is not intended as a guarantee or prediction of the actual returns that would be earned by similar investment vehicles having comparable features. The example is as follows: The hypothetical separate account or fund-of-funds consisted of $100 million in commitments with a fee structure of 1.0% on committed capital during the first four years of the term of the investment and then declining by 10% per year thereafter for the 12-year life of the account. The commitments were made during the first three years in relatively equal increments and the assumption of returns was based on cash flow assumptions derived from a historical database of actual private equity cash flows. Hamilton Lane modeled the impact of fees on four different return streams over a 12-year time period. In these examples, the effect of the fees reduced returns by approximately 2%. This does not include performance fees, since the performance of the account would determine the effect such fees would have on returns. Expenses also vary based on the particular investment vehicle and, therefore, were not included in this hypothetical example. Both performance fees and expenses would further decrease the return.
Hamilton Lane (Germany) GmbH is a wholly-owned subsidiary of Hamilton Lane Advisors, L.L.C. Hamilton Lane (Germany) GmbH is authorised and regulated by the Federal Financial Supervisory Authority (BaFin). In the European Economic Area this communication is directed solely at persons who would be classified as professional investors within the meaning of Directive 2011/61/EU (AIFMD). Its contents are not directed at, may not be suitable for and should not be relied upon by retail clients.
Hamilton Lane (UK) Limited is a wholly-owned subsidiary of Hamilton Lane Advisors, L.L.C. Hamilton Lane (UK) Limited is authorised and regulated by the Financial Conduct Authority (FCA). In the United Kingdom this communication is directed solely at persons who would be classified as a professional client or eligible counterparty under the FCA Handbook of Rules and Guidance. Its contents are not directed at, may not be suitable for and should not be relied upon by retail clients.
Hamilton Lane Advisors, L.L.C. is exempt from the requirement to hold an Australian financial services licence under the Corporations Act 2001 in respect of the financial services by operation of ASIC Class Order 03/1100: U.S. SEC regulated financial service providers. Hamilton Lane Advisors, L.L.C. is regulated by the SEC under U.S. laws, which differ from Australian laws.
Any tables, graphs or charts relating to past performance included in this presentation are intended only to illustrate the performance of the indices, composites, specific accounts or funds referred to for the historical periods shown. Such tables, graphs and charts are not intended to predict future performance and should not be used as the basis for an investment decision.
The information herein is not intended to provide, and should not be relied upon for, accounting, legal or tax advice, or investment recommendations. You should consult your accounting, legal, tax or other advisors about the matters discussed herein.
The calculations contained in this document are made by Hamilton Lane based on information provided by the general partner (e.g. cash flows and valuations), and have not been prepared, reviewed or approved by the general partners.
As of June 7, 2023