
Let’s explore a theme that weaves throughout this overview: Growth versus value investing in the private markets. This is an established perspective in the public markets, but not one the private markets have embraced.
Historically, in private markets, buyouts would have been considered value, and venture would have been considered growth. But since many investors couldn’t access top-tier venture, investors weren’t necessarily expressing a view on the value vs. growth debate.
But that has evolved, and growth is a much broader part of the private markets than simply venture capital.
At the same time, the opportunity set in the private markets has been expanding, while in the public markets it’s been shrinking. There are roughly 20,000 private companies with annual revenues of more than $100 million, compared to just 3,000 public companies.1
For the better part of two decades, the number of publicly listed companies has been in steady decline. While IPOs increased in 2020 as some companies sought to take advantage of buoyant investor sentiment, the number of companies listed on major U.S. exchanges has still shrunk from more than 7,500 at the beginning of 2000, to less than 5,000 at the end of 2020.
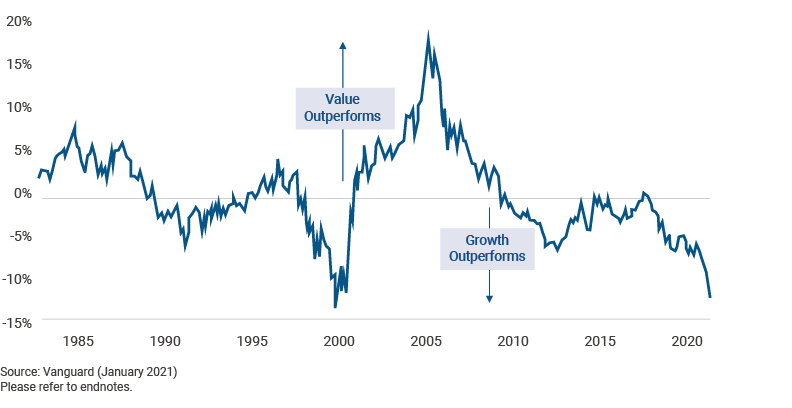
Meanwhile, the public markets have long looked at growth and value as two different ways to invest and, therefore, position portfolios with that in mind. In the public world, growth has been the easy winner over value for most of the last 15 years.
Difference in Annualized Total Returns Over Rolling Five-Year Periods
In the private equity world, buyout was generally viewed as “value” and venture was viewed as “growth.” Tilting the portfolio one way or the other was generally more of a function of your access to top-tier venture than of your view of growth versus value. That dynamic has changed as growth investing in the private markets has become far more than simply venture capital, although venture remains a component of that equation. But, what does “growth” mean in the private context? In the absence of an accepted definition, we thought we’d give it a whirl and try developing one to begin framing the discussion.
Distribution of buyout deal purchase price multiples
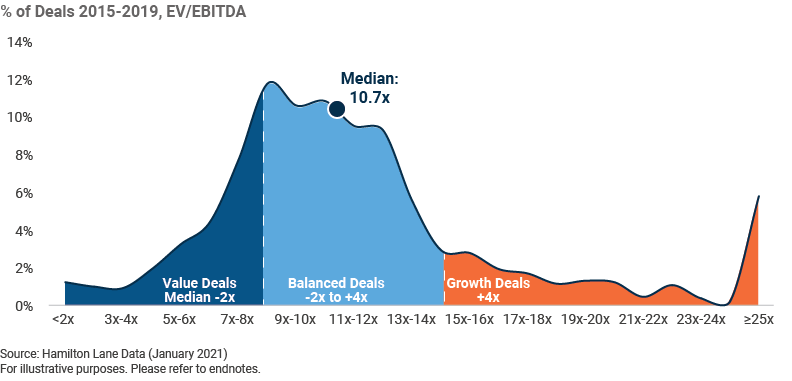
Yes, yes, we could endlessly debate whether these are the precise metrics that should be used to define our categories, but it’s our party and we’ll define how we want to. At least we’ll ask that you accept them for this starting analysis. We’ve made it easy: Growth is four times over, while value is two times under, the particular sector’s EBITDA or revenue multiple at the time of acquisition. So simple, even we can understand it. What we see is that value deals have increased somewhat over time, while growth multiples, whether of revenue or EBITDA, have increased significantly over the last 15 years. That’s neither a good nor bad development on its own; that depends more on performance, which we’ll get to momentarily. First, let’s pretend we’re in someone else’s head for a moment.
We’ll ask you to imagine yourself back in 2020. (Forgive us for asking you to revisit it; we promise we have a point). Imagine you’re a buyout general partner and Hamilton Lane has just shared with you some fascinating information on fundraising and the trend toward growth investing. Now, percentage growth and absolute numbers are two very different things.
Buyout and growth equity global fundraising
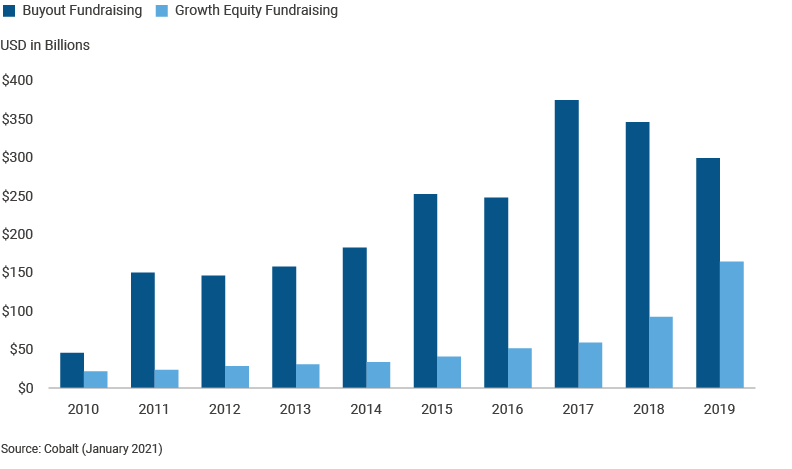
Buyout remains the largest portion of fundraising totals, but it is hard to ignore the dramatic increase in growth equity funds being raised. So, what do you do? Assume it’s a passing fad and that growth will crash while your value approach will win? What if that’s five years away? Will your investors stay with you? You basically have two choices, both as a limited partner and a general partner. (We suppose you have a third option — ignore the whole thing — but we’ll assume if you’ve made it this far into the overview, that’s not the kind of investor you are.) Option 1, You can do growth deals in your buyout fund, or Option 2, you can raise a growth fund.
Growth Equity Global Fundraising
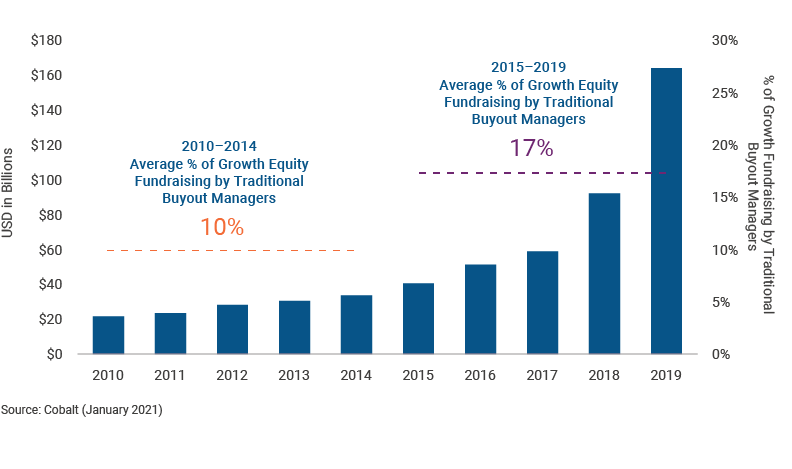
The companion growth equity fund option works, but you can see the total amount raised by that approach is relatively small and, what’s more, it can take a long time to raise sequential funds. A few managers have done it, but have they been successful?
Spread of Returns by Manager and Fund Strategy
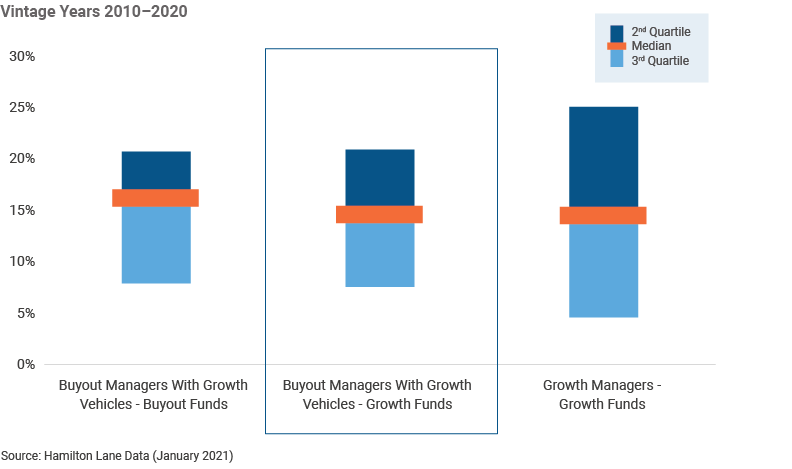
The performance of those companion funds has been good, though not awe-inspiring. Traditional growth managers have wider dispersion, but that’s also where you’re seeing potential for the best returns. Growth funds raised by buyout managers have similar average returns, but the early data suggests the upside is not the same.
Alright, then, what about transforming your fund from a traditional buyout fund to a growth fund? That alchemy can work wonders for your performance and fundraising. But is it possible? Can someone morph from value king to growth queen? Let’s look at the data from a multiple perspective.
Median TVPI Performance
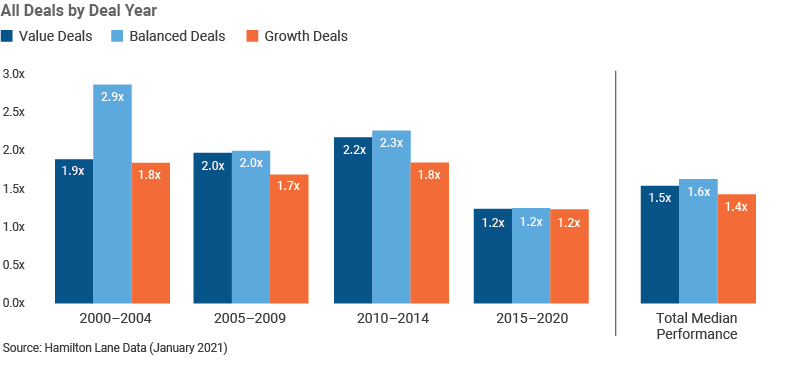
This gets interesting because, unlike the public markets, value has been the place to invest in the private markets world over the last 15 years. Since the early 2000s, value has outpaced growth and, in some time periods, by quite a bit. Growth has been playing catch up and has basically performed on par with value in the most recent five-year period. But wait, Hamilton Lane…
Didn’t we just write gobs of prose saying that growth was the best-performing part of the private markets landscape for almost the last 10 years? How does this data square with that data? (Does data square?) We’re glad you asked.
Median and Top Decile Deal TVPIs
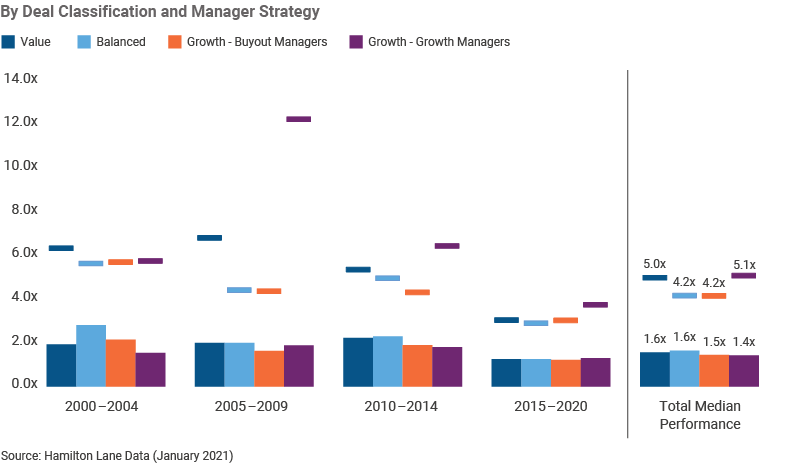
This is interesting stuff! (And feel free to marvel at the quality, depth and use of data we are providing.) Here we’ve added data on the growth equity deals done by traditional growth equity managers. Growth managers generated significantly greater upside than buyout managers who have ventured (yes, a small pun) into growth. In most periods, it’s not even close.
It’s hard to overstate the importance of this point because we have no doubt that the lines between value buyout and growth buyout will blur in many funds. And yet, we also don’t believe the same skill sets are required in each. Some managers will do it well and others will buy high-priced assets, run the value playbook and wonder why their returns are mediocre. You don’t become a city mouse simply by moving out of the country, or vice versa.
Average TVPIs
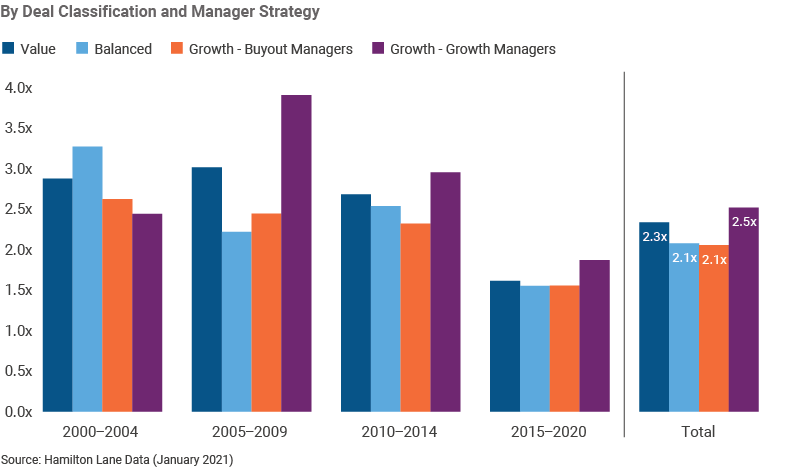
The prior chart looked at median and top decile deals, and this chart looks at average deals. The conclusions remain similar, although the spreads narrow marginally in certain periods.
And yet do we sense, once more, some skepticism?
Groth-Oriented value creation and value-oriented value creation
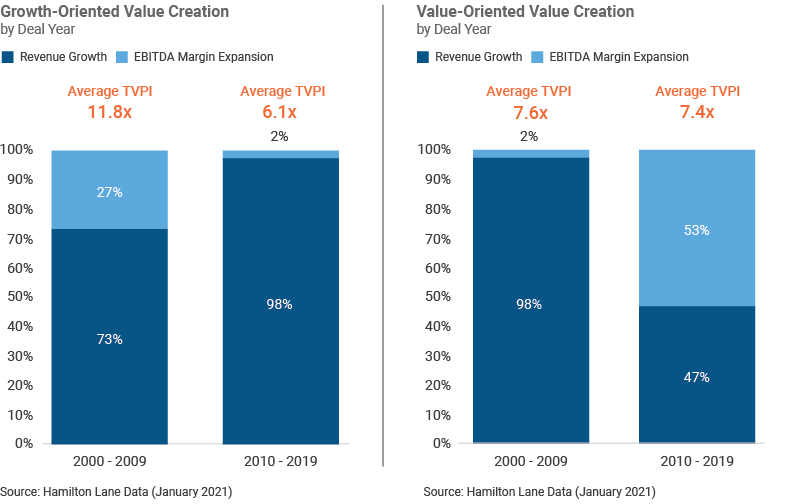
We looked at the top 10% of all realized deals in these time periods. A few things jump out at us:
- The first take is that growth’s upside has diminished over the last 20 years, while value’s has held steady. However, recall our earlier data that suggests part of that reason is those infernal value managers trying to do growth.
- Take a look at where value is being created. Growth deals have become even more about growing revenue, whereas value deals have shifted dramatically from finding new sources of revenue to finding ways to improve margin.
- Where else do you see data being used like this? (A shameless plug, but hey, c’mon, don’t you wish you could do this with your data or you were working with someone who could help you do this?)
Think back to the opportunity set framework in public versus private markets from the beginning of this piece. We know that the private markets pond is much bigger, with many more fish. But should you be looking for growth fish or value fish? Where do you believe the best returns will come from over the next five years? Value-oriented deals where managers pay lower prices and improve margins, or growth-oriented plays where managers pay higher prices and grow revenue? Your answer will say a great deal about whether you outperform compared to private equity benchmarks.
But, wait! There’s more to this analysis and you’re going to love this next part.
Let’s consider how we should be thinking about portfolios as part of this discussion, and how growth has begun to drive performance.
Distribution of Trailing 10-year portfolio returns
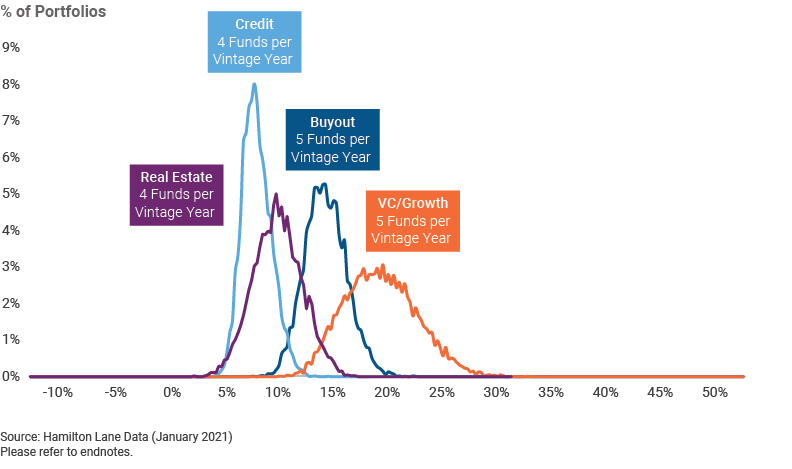
Don’t focus too much on our parameters in terms of how many funds were chosen in each category. Focus on the cluster of return probabilities and the spread of those returns. This is over a 10-year period and this looks far closer to public market performance than what you might expect. The growth/VC category generates higher returns, but we knew that from our earlier charts on fund performance. What we didn’t know is that growth has outperformed even accounting for risk. The selection risk is higher, shown by the wider distribution spread, but much of the lower return portion of the curve is still showing better returns than buyout strategies. Now look at a shorter time frame.
Distribution of Trailing 3-Year Portfolio Returns
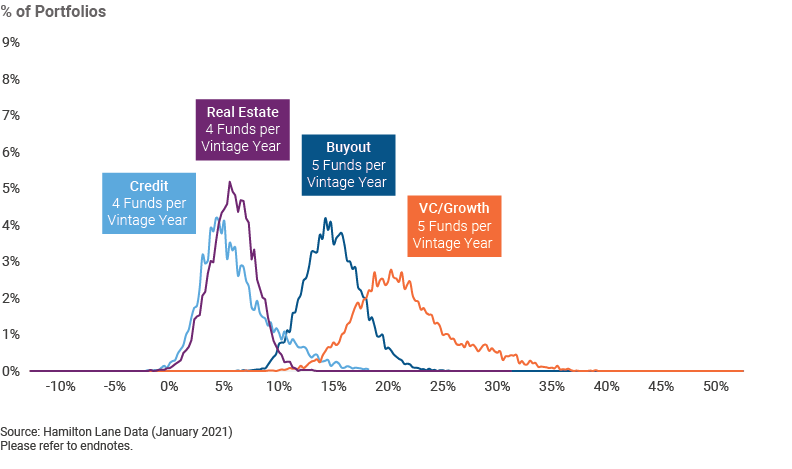
Over this three-year period, growth’s stronger return numbers meant a portfolio tilted in that direction easily beat one leaning to buyout. Sure, you have a higher risk because selection is crucial, but the outperformance makes that risk worth taking. If we showed you the one-year figures, you might be even more convinced, although we acknowledge that one-year numbers in these asset classes have too much noise to make them a basis on which you’ll make this kind of decision. Our point remains the same: Investment choices across the private markets are increasingly bifurcated, and we will need to choose how to construct portfolios in ways we have not in the past.
Endnotes
1 Source: Capital IQ, April 2018
2 Jay R. Ritter, University of Florida
Chart 2.28: Using data from Russell, December 31, 1983 through July, 31 2020.
Chart 2.29: Deals within Buyout funds are classified as value/balanced/growth based on the following process & criteria. First, deals are grouped by deal vintage year and GICS sector to create vintage year/GICS sector benchmarks. For a given benchmark, a deal’s acquisition valuation multiple (EV/EBITDA at acquisition) is compared to the benchmark’s median acquisition valuation multiple. If the deal’s valuation multiple is between -2x and +4x of the benchmark multiple, the deal is classified as balanced; if the multiple is less than -2x of the benchmark multiple, the deal is classified as value; if the multiple is greater than +4x of the benchmark multiple, the deal is classified as growth. For all deals within the dataset that do not have an acquisition valuation multiple, a deal’s acquisition revenue multiple (Revenue/EBITDA at acquisition) is compared to the benchmark’s median acquisition revenue multiple. If the deal’s revenue multiple is between -0.5x and +0.5x of the benchmark multiple, the deal is classified as balanced; if the deal’s multiple is less than -0.5x of the benchmark multiple, the deal is classified as value; if the deal’s multiple is greater than +0.5x of the benchmark multiple, the deal is classified as growth. At this point, all deals have been classified as either value, balanced or growth. Then, for all deals that have been classified as balanced, if the deal’s acquisition leverage multiple (Net Debt/EBITDA at acquisition) is less than 4x, the deal is reclassified as growth; otherwise, it remains classified as balanced. Finally, any deal classified as growth thus far that has an acquisition revenue multiple less than the median acquisition revenue multiple for all value deals in the dataset is reclassified as a value deal; otherwise, the deal remains classified as a growth deal.
Chart 2.37, Chart 2.38: Sample portfolios were created for buyout, credit, growth & VC, and real estate by running a simulation choosing a certain amount of funds (depending on strategy) for each vintage year from 2010 – 2019. Buyout Portfolios and VC/Growth Portfolios chose 5 funds per vintage year and Credit and Real Estate Portfolios chose 4 funds per vintage year. Groupings of funds were chosen by random for each vintage year and then the portfolio’s returns were calculated on a 3 year and 10 year point-to-point basis. The simulation was run 10,000 times for each asset class. Plotted are the return distributions from those simulations.
Definitions
Corporate Finance/Buyout: Any PM fund that generally takes control position by buying a company.
Credit: This strategy focuses on providing debt capital.
Disclosures
This presentation is not an offer to sell, or a solicitation of any offer to buy, any security or to enter into any agreement with Hamilton Lane or any of its affiliates. Any such offering will be made only at your request. We do not intend that any public offering will be made by us at any time with respect to any potential transaction discussed in this presentation. Any offering or potential transaction will be made pursuant to separate documentation negotiated between us, which will supersede entirely the information contained herein.
Any tables, graphs or charts relating to past performance included in this presentation are intended only to illustrate the performance of the indices, composites, specific accounts or funds referred to for the historical periods shown. Such tables, graphs and charts are not intended to predict future performance and should not be used as the basis for an investment decision.
The information herein is not intended to provide, and should not be relied upon for, accounting, legal or tax advice, or investment recommendations. You should consult your accounting, legal, tax or other advisors about the matters discussed herein.
As of February 16, 2021